US500 (S&P 500), here's a breakdown of the potential bearish targets you're pointing to:
---
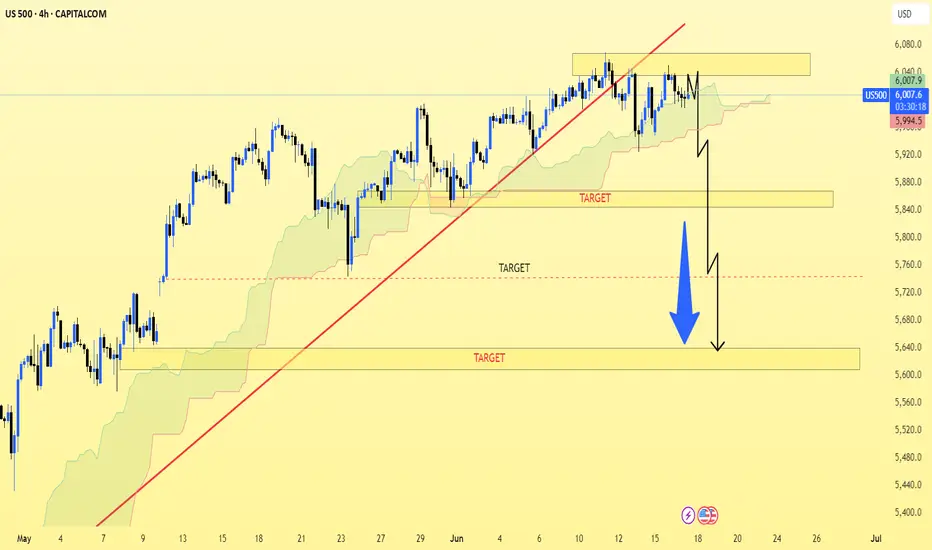
📉 Market Overview:
Price has broken below the trendline and is currently hovering near the Ichimoku cloud support.
The bearish path is outlined on the chart with multiple target zones indicated by horizontal lines and a large blue arrow.
---
🎯 Bearish Targets (as shown on your chart):
1. First Target Zone: Around 5,920 – 5,930
Minor support area just below current range.
2. Second Target Zone: Around 5,860 – 5,870
A more solid prior demand zone.
3. Final Target Zone: Around 5,780 – 5,790
Major support zone, aligns with previous consolidation area.
---
🧭 Strategy Notes:
If price closes below 5,950 on the 4H or daily candle, it may confirm a stronger bearish continuation.
Keep an eye on volume and price reaction near 5,920, as this is likely the first bounce zone.
Would you like a marked-up version of this chart with exact price levels and arrows for clarity?
---
📉 Market Overview:
Price has broken below the trendline and is currently hovering near the Ichimoku cloud support.
The bearish path is outlined on the chart with multiple target zones indicated by horizontal lines and a large blue arrow.
---
🎯 Bearish Targets (as shown on your chart):
1. First Target Zone: Around 5,920 – 5,930
Minor support area just below current range.
2. Second Target Zone: Around 5,860 – 5,870
A more solid prior demand zone.
3. Final Target Zone: Around 5,780 – 5,790
Major support zone, aligns with previous consolidation area.
---
🧭 Strategy Notes:
If price closes below 5,950 on the 4H or daily candle, it may confirm a stronger bearish continuation.
Keep an eye on volume and price reaction near 5,920, as this is likely the first bounce zone.
Would you like a marked-up version of this chart with exact price levels and arrows for clarity?
Trade active
trade activeRelated publications
Disclaimer
The information and publications are not meant to be, and do not constitute, financial, investment, trading, or other types of advice or recommendations supplied or endorsed by TradingView. Read more in the Terms of Use.
Related publications
Disclaimer
The information and publications are not meant to be, and do not constitute, financial, investment, trading, or other types of advice or recommendations supplied or endorsed by TradingView. Read more in the Terms of Use.