Updated
SP500 Ongoing M Formation.
Hello Traders,
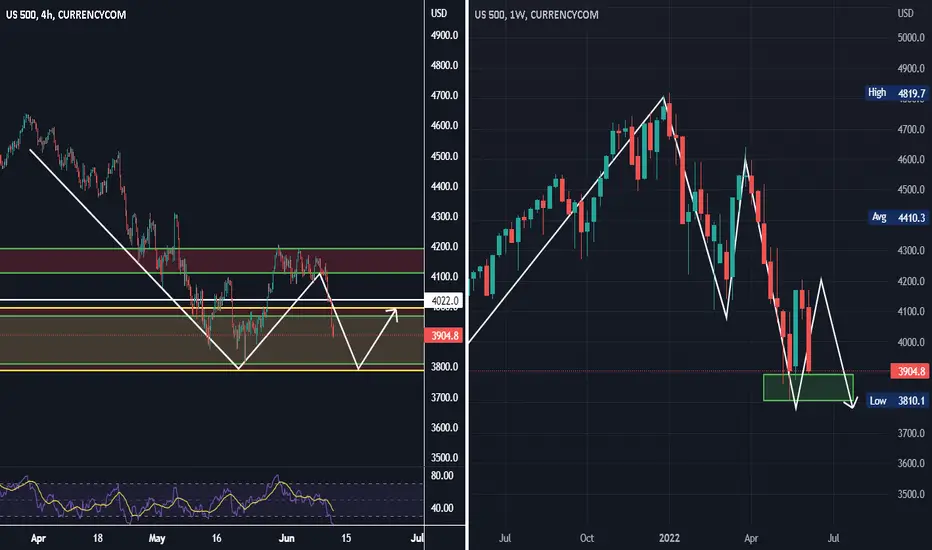
I have been talking for months about an ongoing M formation on the Sp500 chart with two peaks at the highs and retracement at the neckline.
Now a retest to higher levels or continuation downward is also likely. It will be clear how to move this week based on whether it breakout or not.
I have been talking for months about an ongoing M formation on the Sp500 chart with two peaks at the highs and retracement at the neckline.
Now a retest to higher levels or continuation downward is also likely. It will be clear how to move this week based on whether it breakout or not.
Trade active
Related publications
Disclaimer
The information and publications are not meant to be, and do not constitute, financial, investment, trading, or other types of advice or recommendations supplied or endorsed by TradingView. Read more in the Terms of Use.
Related publications
Disclaimer
The information and publications are not meant to be, and do not constitute, financial, investment, trading, or other types of advice or recommendations supplied or endorsed by TradingView. Read more in the Terms of Use.