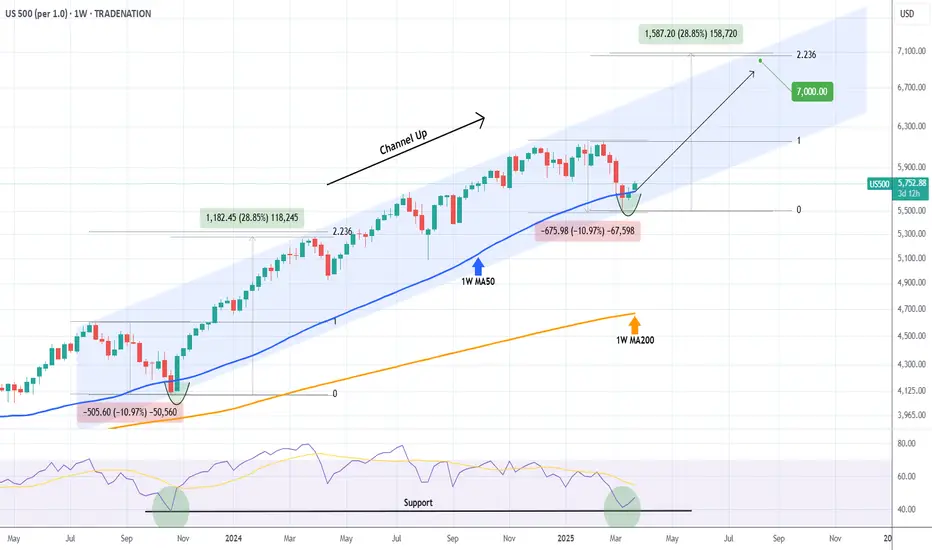
The S&P500 index (SPX) is in the process of posting its 2nd straight green 1W candle, following a streak of 4 red weeks since the February 17 peak. That streaκ was technically the Bearish Leg of the 1.5-year Channel Up and as you can see, it made a direct contact with its bottom (Higher Lows trend-line).
As the same time, the 1W RSI almost touched the 40.00 Support that priced the October 23 2023 Low, which was the previous Higher Low of the Channel Up. The similarities don't stop there as both Bearish Legs had approximately a -10.97% decline, the strongest within that time-frame.
The Bullish Leg that followed that bottom initially peaked on a +28.85% rise, almost touching the 2.236 Fibonacci extension. Assuming the symmetry holds between the Bullish Legs as well, we can be expecting the index to start the new Bullish Leg now and target 7000 by the end of the year, which is marginally below both the 2.236 Fib ext and a potential +28.85% rise.
This may indeed be the best buy opportunity for 2025.
-------------------------------------------------------------------------------
** Please LIKE 👍, FOLLOW ✅, SHARE 🙌 and COMMENT ✍ if you enjoy this idea! Also share your ideas and charts in the comments section below! This is best way to keep it relevant, support us, keep the content here free and allow the idea to reach as many people as possible. **
-------------------------------------------------------------------------------
Disclosure: I am part of Trade Nation's Influencer program and receive a monthly fee for using their TradingView charts in my analysis.
💸💸💸💸💸💸
👇 👇 👇 👇 👇 👇
👑Best Signals (Forex/Crypto+70% accuracy) & Account Management (+20% profit/month on 10k accounts)
💰Free Channel t.me/tradingshotglobal
🤵Contact info@tradingshot.com t.me/tradingshot
🔥New service: next X100 crypto GEMS!
💰Free Channel t.me/tradingshotglobal
🤵Contact info@tradingshot.com t.me/tradingshot
🔥New service: next X100 crypto GEMS!
Disclaimer
The information and publications are not meant to be, and do not constitute, financial, investment, trading, or other types of advice or recommendations supplied or endorsed by TradingView. Read more in the Terms of Use.