By Ion Jauregui – Analyst at ActivTrades
A silent battle is being fought on Wall Street between humans and machines. Quants — algorithmic traders who operate by following trends — are showing a level of optimism not seen since January 2020, according to Deutsche Bank AG (Ticker AT:DBK.GE). In contrast, “flesh and blood” managers have reduced their equity exposure to modestly underweight levels, pressured by the risk of new Trump tariffs, weaker-than-expected economic growth, and corporate earnings that remain unconvincing.
The S&P 500 has risen nearly 30% since April, bringing systematic long positions to their highest level in four years. Goldman Sachs (Ticker AT:GS.US) reports that Commodity Trading Advisors (CTAs) now control about $50 billion in U.S. equities, placing them in the 92nd percentile of historical exposure. Such an extreme positioning has not been seen since periods preceding major market moves.
Deutsche Bank was among the first to warn about this divergence between quantitative and discretionary trading: while trend-following models keep adding positions, manually managed portfolios are prioritizing capital protection. Goldman Sachs, for its part, offers the clearest risk assessment: aggressive accumulation by CTAs leaves the market highly exposed to feedback-driven moves. And UBS Group AG (Ticker AT:UBSG.CH) warns that if the S&P 500 falls just 4.5% to 6,100 points, these systems could trigger massive selling, creating a domino effect that would accelerate the correction.
The backdrop adds more tension: the VIX volatility index remains around 15 points, its lowest level since February. This apparent calm acts like a stretched rubber band ready to snap. In the event of a sharp pullback, discretionary managers might step in to “buy the dip” and prevent a deeper sell-off, yet the sense that the market is approaching a top is becoming increasingly tangible.
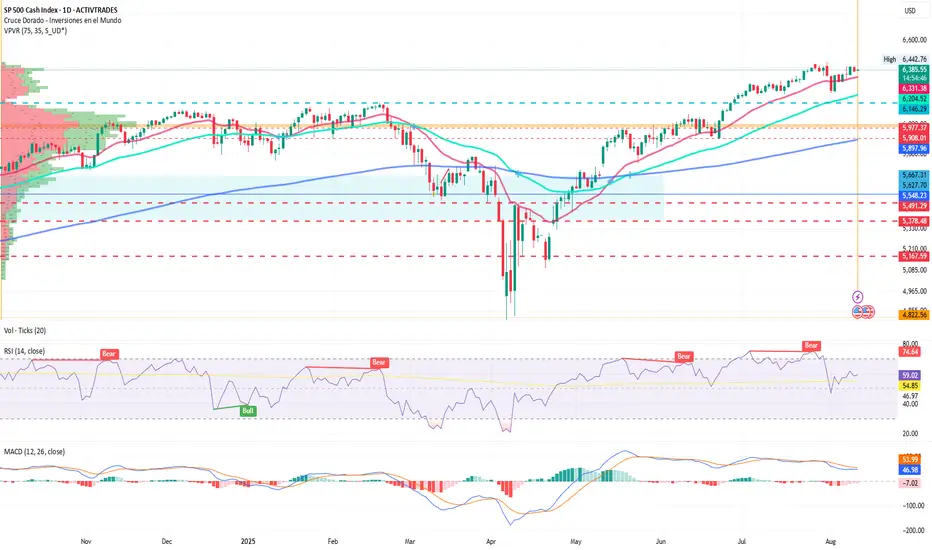
Technical Analysis – S&P 500
The index maintains an underlying bullish structure, but with overbought signals on daily and weekly charts. Currently, the RSI shows mild overbought conditions at 58.7%, while the MACD indicates a bearish divergence and a red histogram with low volume — a sign of possible price consolidation.
• Key resistance: 6,442.76 points, the recent all-time high and a psychological ceiling that could halt further gains if quantitative momentum fades.
• Intermediate support: 6,204 points, where short-term moving averages converge with previous consolidation areas.
• Critical support: 6,060 points, identified by the Point of Control (POC) as the threshold for triggering massive algorithmic selling; a break below this level could open the door to declines toward 5,950 or 5,908 points.
As long as 6,060 holds, the primary trend still favors the bulls. However, the high concentration of systematic long positions suggests that any correction could be swift and violent, forcing traders to react quickly.
*******************************************************************************************
The information provided does not constitute investment research. The material has not been prepared in accordance with the legal requirements designed to promote the independence of investment research and such should be considered a marketing communication.
All information has been prepared by ActivTrades ("AT"). The information does not contain a record of AT's prices, or an offer of or solicitation for a transaction in any financial instrument. No representation or warranty is given as to the accuracy or completeness of this information.
Any material provided does not have regard to the specific investment objective and financial situation of any person who may receive it. Past performance and forecasting are not a synonym of a reliable indicator of future performance. AT provides an execution-only service. Consequently, any person acting on the information provided does so at their own risk. Political risk is unpredictable. Central bank actions can vary. Platform tools do not guarantee success.
Disclaimer
The information and publications are not meant to be, and do not constitute, financial, investment, trading, or other types of advice or recommendations supplied or endorsed by TradingView. Read more in the Terms of Use.
Disclaimer
The information and publications are not meant to be, and do not constitute, financial, investment, trading, or other types of advice or recommendations supplied or endorsed by TradingView. Read more in the Terms of Use.