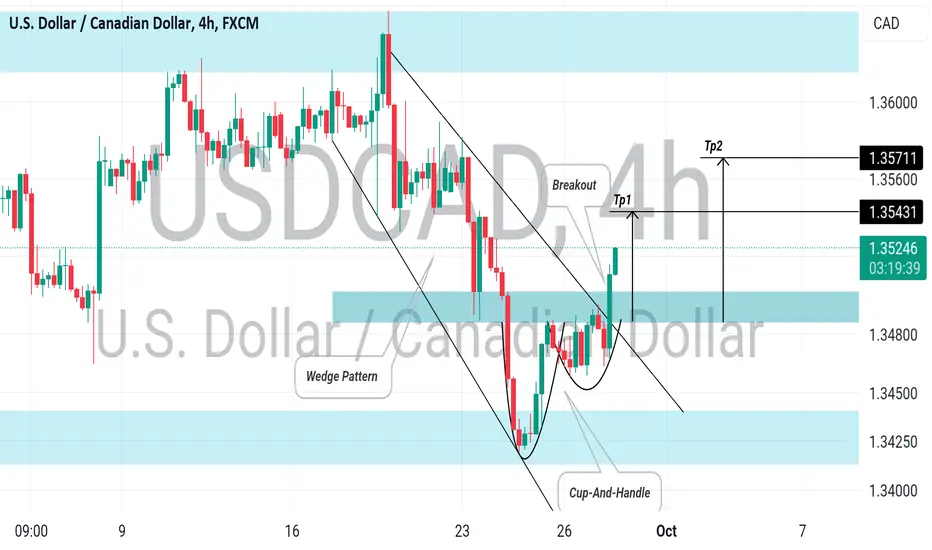
USDCAD has formed two bullish chart patterns: a falling wedge and a cup-and-handle pattern within it.
Recently, a single 4-hour candle breached both the pattern's neckline and the wedge's resistance line.
This breakout suggests a bullish trend continuation, targeting 1.4543 and 1.3571.
Recently, a single 4-hour candle breached both the pattern's neckline and the wedge's resistance line.
This breakout suggests a bullish trend continuation, targeting 1.4543 and 1.3571.
Join our Telegram channel for daily market update 👇👇
t.me/TheAceTrading
For paid signal👇👇 t.me/linofx1999
t.me/TheAceTrading
For paid signal👇👇 t.me/linofx1999
Disclaimer
The information and publications are not meant to be, and do not constitute, financial, investment, trading, or other types of advice or recommendations supplied or endorsed by TradingView. Read more in the Terms of Use.