USDCAD: Oil Price Weakness Weighs on CAD – Can USD Capitalize?
Hello TradingView community!
Today, let's analyze the USDCAD pair, which is showing interesting dynamics as the CAD faces pressure from falling oil prices.
🌍 Macro Drivers: CAD Struggles Amidst Lower Oil, USD Upside Limited
The USDCAD pair is caught in a tug-of-war between the Canadian Dollar (CAD) and the US Dollar (USD):
CAD pressured by oil: The Canadian Dollar has seen its gains trimmed, primarily weighed down by lower crude oil prices. Canada, being a major oil exporter, sees its currency directly impacted by these fluctuations.
Oil prices lower: A recent truce between Israel and Iran is keeping crude oil prices significantly lower (16% below Monday's highs), directly affecting CAD's strength.
USD's limited upside: Despite CAD's weakness, the US Dollar's upside attempts are being constrained by recent soft US economic data and persistent hopes for Federal Reserve (Fed) monetary policy easing.
In summary, USDCAD is seeing a slight upward tick due to a weaker CAD from oil price drops, but the USD's rally is somewhat capped by Fed easing expectations.
📊 Technical Analysis & USDCAD Trading Plan
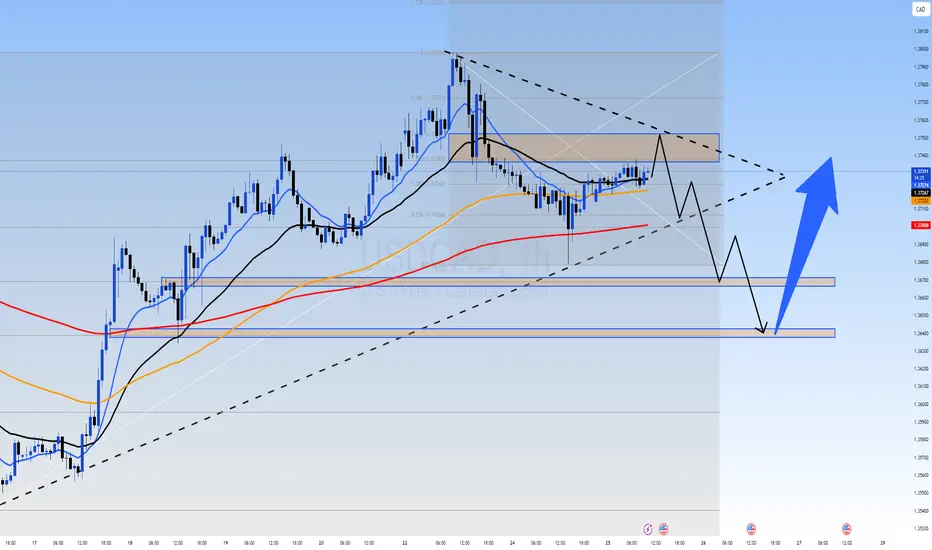
Based on the USDCAD chart (H4/M30) provided:
Overall Trend: USDCAD is trading within an ascending channel, but shows signs of weakness near the channel's upper boundary. Price appears to be forming a lower high after a previous upward move.
Key Price Levels:
Potential SELL Zone (Resistance): Clearly identified around 1.36989. This is a strong resistance level, coinciding with recent local highs. Selling pressure is likely to emerge here.
Key Support (Potential BUY Zone): Around 1.36734 and further down at 1.36431. The 1.36431 level is particularly significant, aligning with a major Fibonacci level (1.382) and acting as a robust demand area from prior price action.
Moving Averages (EMAs): Price is trading near the EMAs (black, orange, red), indicating a consolidation phase and potential for a significant move.
Projected Price Action: The chart suggests that USDCAD could pull back from the current resistance zone (1.36989) towards the support levels below, particularly 1.36431, before potentially finding buying interest to resume an upward trend.
🎯 USDCAD Trading Plan:
SELL ZONE: 1.36989
SL: 1.37050
TP: 1.36900 - 1.36850 - 1.36800 - 1.36750 - 1.36700 - 1.36600 - 1.36500 - 1.36431
BUY ZONE: 1.36431
SL: 1.36300
TP: 1.36500 - 1.36550 - 1.36600 - 1.36650 - 1.36700 - 1.36750 - 1.36800 - 1.36900
⚠️ Key Factors to Monitor:
Crude Oil Prices: Any significant movements in crude oil will directly impact the CAD.
US Economic Data: Upcoming reports on inflation and employment from the US could heavily influence Fed policy expectations and USD strength.
Bank of Canada (BoC) Policy: Statements or decisions from the BoC will also be a critical factor affecting the CAD.
Trade smart and stay vigilant! Wishing everyone a successful USDCAD trading day!
Hello TradingView community!
Today, let's analyze the USDCAD pair, which is showing interesting dynamics as the CAD faces pressure from falling oil prices.
🌍 Macro Drivers: CAD Struggles Amidst Lower Oil, USD Upside Limited
The USDCAD pair is caught in a tug-of-war between the Canadian Dollar (CAD) and the US Dollar (USD):
CAD pressured by oil: The Canadian Dollar has seen its gains trimmed, primarily weighed down by lower crude oil prices. Canada, being a major oil exporter, sees its currency directly impacted by these fluctuations.
Oil prices lower: A recent truce between Israel and Iran is keeping crude oil prices significantly lower (16% below Monday's highs), directly affecting CAD's strength.
USD's limited upside: Despite CAD's weakness, the US Dollar's upside attempts are being constrained by recent soft US economic data and persistent hopes for Federal Reserve (Fed) monetary policy easing.
In summary, USDCAD is seeing a slight upward tick due to a weaker CAD from oil price drops, but the USD's rally is somewhat capped by Fed easing expectations.
📊 Technical Analysis & USDCAD Trading Plan
Based on the USDCAD chart (H4/M30) provided:
Overall Trend: USDCAD is trading within an ascending channel, but shows signs of weakness near the channel's upper boundary. Price appears to be forming a lower high after a previous upward move.
Key Price Levels:
Potential SELL Zone (Resistance): Clearly identified around 1.36989. This is a strong resistance level, coinciding with recent local highs. Selling pressure is likely to emerge here.
Key Support (Potential BUY Zone): Around 1.36734 and further down at 1.36431. The 1.36431 level is particularly significant, aligning with a major Fibonacci level (1.382) and acting as a robust demand area from prior price action.
Moving Averages (EMAs): Price is trading near the EMAs (black, orange, red), indicating a consolidation phase and potential for a significant move.
Projected Price Action: The chart suggests that USDCAD could pull back from the current resistance zone (1.36989) towards the support levels below, particularly 1.36431, before potentially finding buying interest to resume an upward trend.
🎯 USDCAD Trading Plan:
SELL ZONE: 1.36989
SL: 1.37050
TP: 1.36900 - 1.36850 - 1.36800 - 1.36750 - 1.36700 - 1.36600 - 1.36500 - 1.36431
BUY ZONE: 1.36431
SL: 1.36300
TP: 1.36500 - 1.36550 - 1.36600 - 1.36650 - 1.36700 - 1.36750 - 1.36800 - 1.36900
⚠️ Key Factors to Monitor:
Crude Oil Prices: Any significant movements in crude oil will directly impact the CAD.
US Economic Data: Upcoming reports on inflation and employment from the US could heavily influence Fed policy expectations and USD strength.
Bank of Canada (BoC) Policy: Statements or decisions from the BoC will also be a critical factor affecting the CAD.
Trade smart and stay vigilant! Wishing everyone a successful USDCAD trading day!
⚜️ Trade with Money Market Flow, logic, Price action 📉📈
⚜️Risk Reward 1.3 to 2.5...
⚜️Daily 8 to 15 Signals VIP
Get quality daily trading signals and plans here
JOIN NOW
t.me/+iimmVCgUnK5mZTRl
⚜️Risk Reward 1.3 to 2.5...
⚜️Daily 8 to 15 Signals VIP
Get quality daily trading signals and plans here
JOIN NOW
t.me/+iimmVCgUnK5mZTRl
Disclaimer
The information and publications are not meant to be, and do not constitute, financial, investment, trading, or other types of advice or recommendations supplied or endorsed by TradingView. Read more in the Terms of Use.