Statistics Canada is scheduled to release the closely watched April Consumer Price Index (CPI) data during the North American trading session. As a key inflation indicator, this data will significantly impact the interest rate decisions of the Bank of Canada (BoC). The daily chart of USD/CAD exhibits notable technical pattern shifts:
Technical Analysis
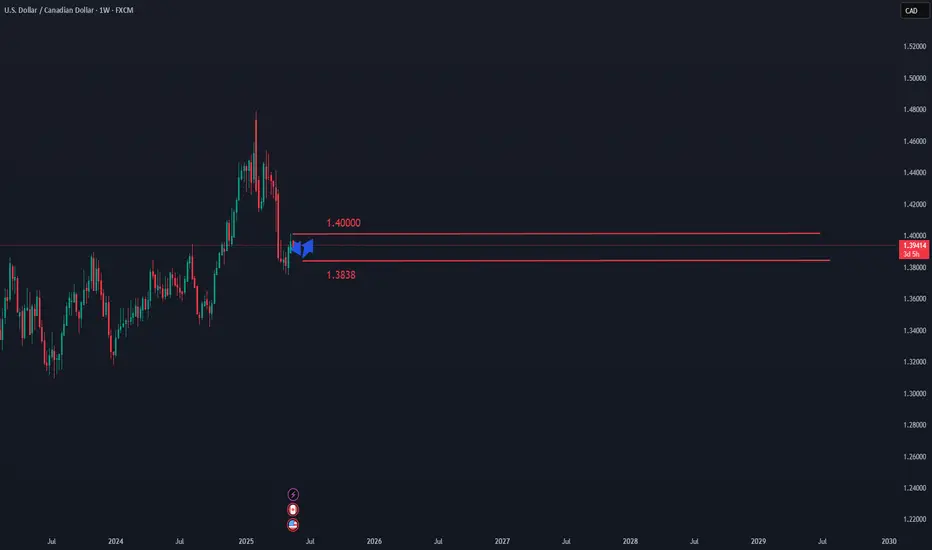
Breakout and Resistance Zone Test
The pair has recently breached the 1.3900 psychological level and is currently testing a critical resistance zone.
A double-bottom reversal pattern formed after prices rebounded from the recent low of 1.3749, signaling potential bullish momentum for a trend reversal.
The MACD indicator has shown a decisive upward pivot, with the DIFF line crossing above the DEA line (forming a "golden cross"), and the histogram shifting from green to red, confirming that upward momentum is accumulating.
Market Sentiment
Current market sentiment is characterized by cautious optimism, as traders weigh technical bullish signals against the potential fundamental volatility triggered by the CPI release.
Key Implications of CPI Data
Higher-than-Expected Inflation: If the CPI exceeds expectations, it could strengthen the BoC’s hawkish stance, potentially pushing USD/CAD lower toward the 1.3850–1.3800 support level.
Lower-than-Expected Inflation: A softer CPI may fuel expectations of BoC policy easing, driving USD/CAD toward the 1.4000–1.4050 resistance zone.
Trading Considerations
Bullish Scenario: A daily close above 1.3950 would validate the breakout, targeting 1.4080 (the measured move derived from the double-bottom pattern).
Bearish Scenario: A rejection at the resistance zone, combined with weak USD momentum, could trigger a retracement to 1.3820 (the neckline of the double-bottom).
Risk Management: Traders are advised to set tight stop-loss orders around key levels (e.g., below 1.3880 for bullish positions, above 1.3980 for bearish positions) ahead of the data-induced volatility.
The CPI report represents a pivotal inflection point, with the potential to either reinforce the technical breakout or prompt a trend reversal. Market participants should monitor real-time data releases and subsequent BoC communications for directional cues.
Technical Analysis
Breakout and Resistance Zone Test
The pair has recently breached the 1.3900 psychological level and is currently testing a critical resistance zone.
A double-bottom reversal pattern formed after prices rebounded from the recent low of 1.3749, signaling potential bullish momentum for a trend reversal.
The MACD indicator has shown a decisive upward pivot, with the DIFF line crossing above the DEA line (forming a "golden cross"), and the histogram shifting from green to red, confirming that upward momentum is accumulating.
Market Sentiment
Current market sentiment is characterized by cautious optimism, as traders weigh technical bullish signals against the potential fundamental volatility triggered by the CPI release.
Key Implications of CPI Data
Higher-than-Expected Inflation: If the CPI exceeds expectations, it could strengthen the BoC’s hawkish stance, potentially pushing USD/CAD lower toward the 1.3850–1.3800 support level.
Lower-than-Expected Inflation: A softer CPI may fuel expectations of BoC policy easing, driving USD/CAD toward the 1.4000–1.4050 resistance zone.
Trading Considerations
Bullish Scenario: A daily close above 1.3950 would validate the breakout, targeting 1.4080 (the measured move derived from the double-bottom pattern).
Bearish Scenario: A rejection at the resistance zone, combined with weak USD momentum, could trigger a retracement to 1.3820 (the neckline of the double-bottom).
Risk Management: Traders are advised to set tight stop-loss orders around key levels (e.g., below 1.3880 for bullish positions, above 1.3980 for bearish positions) ahead of the data-induced volatility.
The CPI report represents a pivotal inflection point, with the potential to either reinforce the technical breakout or prompt a trend reversal. Market participants should monitor real-time data releases and subsequent BoC communications for directional cues.
Disclaimer
The information and publications are not meant to be, and do not constitute, financial, investment, trading, or other types of advice or recommendations supplied or endorsed by TradingView. Read more in the Terms of Use.
Disclaimer
The information and publications are not meant to be, and do not constitute, financial, investment, trading, or other types of advice or recommendations supplied or endorsed by TradingView. Read more in the Terms of Use.