Current Technical Landscape
Market Sentiment & Drivers
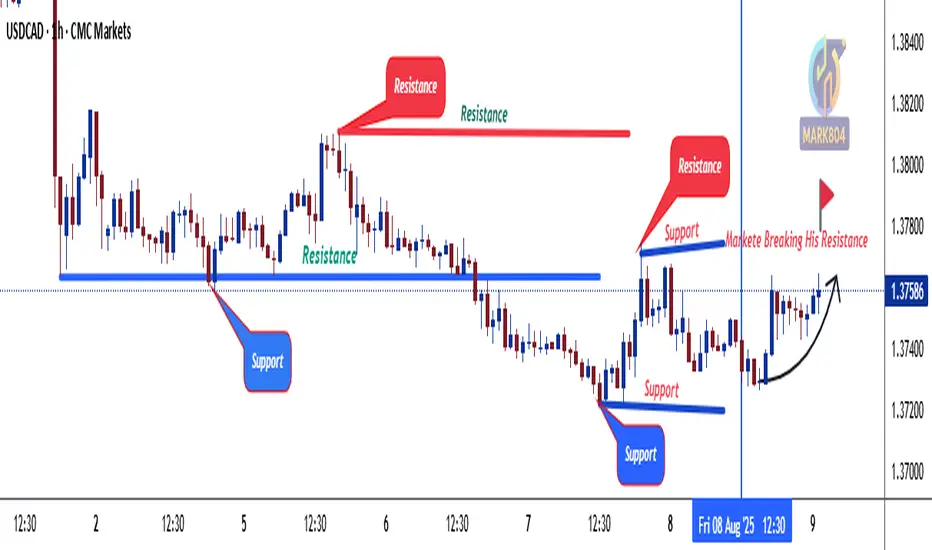
The USD/CAD has risen modestly following Canada’s weak jobs data showing a −40.8 k drop in employment, raising expectations of dovish Bank of Canada policy and fueling a weaker Loonie.
Meanwhile, signals of a more dovish Fed—especially after Trump’s appointed governor tone—have added further downward pressure on the USD.
Key Levels & Technical Indicators
ActionForex (Intraday):
4H MACD has crossed above its signal, neutralizing bias for now.
Break below 1.3720 could target a deeper fall back to 1.3538 — the recent corrective low.
Break above 1.3809 would invalidate that bearish view and suggest a retest of 1.3878.
ActionForex (Weekly):
The pair hovered around 1.3720 last week with a neutral weekly bias.
A downside break could confirm continuation of the corrective decline toward 1.3538.
A bullish breakout beyond 1.3809 could lead to a retest of 1.3878 and possibly higher.
StockTA (as of July 28):
Overall sentiment remains bearish (score: −0.26), particularly in the short-term (−0.48).
Key resistance cluster around 1.47 to 1.45, with multiple levels noted between 1.47 and 1.37.
Support appears near 1.36, based on their analysis.
Marketscreener (latest in July):
Short-term trend: Neutral; Mid-term trend: Bearish; Long-term trend: Neutral.
Short-term resistance: 1.3733, support: 1.3571.
Mid-term resistance: 1.3978, support: 1.3571.
Long-term resistance: 1.4524, support: 1.3490.
Interpretation: Bearish Zone “Coming Up”
The phrase “bearish zone comes up” likely refers to the pair approaching a key resistance area where bearish reversal pressure is increasing. Currently:
1.3720–1.3809 is a critical near-term range. A failure to break above 1.3809 may invite renewed downside toward 1.3538.
Medium-term resistance clusters between 1.37 and 1.40 are also zones where bearish setups may form.
Broader resistance around 1.45–1.47 remains the major structural ceiling, although this lies further out unless the bias shifts.
Strategy Considerations
Bearish setup: Wait for rejection near 1.38, ideally with confirmation (e.g. bearish candle, MACD crossover). A break below 1.3720 could accelerate retest of 1.3538.
Bullish invalidation: A sustained move above 1.3809 could negate the immediate bearish bias, opening targets back toward 1.3878 and beyond.
Market Sentiment & Drivers
The USD/CAD has risen modestly following Canada’s weak jobs data showing a −40.8 k drop in employment, raising expectations of dovish Bank of Canada policy and fueling a weaker Loonie.
Meanwhile, signals of a more dovish Fed—especially after Trump’s appointed governor tone—have added further downward pressure on the USD.
Key Levels & Technical Indicators
ActionForex (Intraday):
4H MACD has crossed above its signal, neutralizing bias for now.
Break below 1.3720 could target a deeper fall back to 1.3538 — the recent corrective low.
Break above 1.3809 would invalidate that bearish view and suggest a retest of 1.3878.
ActionForex (Weekly):
The pair hovered around 1.3720 last week with a neutral weekly bias.
A downside break could confirm continuation of the corrective decline toward 1.3538.
A bullish breakout beyond 1.3809 could lead to a retest of 1.3878 and possibly higher.
StockTA (as of July 28):
Overall sentiment remains bearish (score: −0.26), particularly in the short-term (−0.48).
Key resistance cluster around 1.47 to 1.45, with multiple levels noted between 1.47 and 1.37.
Support appears near 1.36, based on their analysis.
Marketscreener (latest in July):
Short-term trend: Neutral; Mid-term trend: Bearish; Long-term trend: Neutral.
Short-term resistance: 1.3733, support: 1.3571.
Mid-term resistance: 1.3978, support: 1.3571.
Long-term resistance: 1.4524, support: 1.3490.
Interpretation: Bearish Zone “Coming Up”
The phrase “bearish zone comes up” likely refers to the pair approaching a key resistance area where bearish reversal pressure is increasing. Currently:
1.3720–1.3809 is a critical near-term range. A failure to break above 1.3809 may invite renewed downside toward 1.3538.
Medium-term resistance clusters between 1.37 and 1.40 are also zones where bearish setups may form.
Broader resistance around 1.45–1.47 remains the major structural ceiling, although this lies further out unless the bias shifts.
Strategy Considerations
Bearish setup: Wait for rejection near 1.38, ideally with confirmation (e.g. bearish candle, MACD crossover). A break below 1.3720 could accelerate retest of 1.3538.
Bullish invalidation: A sustained move above 1.3809 could negate the immediate bearish bias, opening targets back toward 1.3878 and beyond.
Gold free signale
t.me/GoldsignalMark804
My Channel link
t.me/GoldsignalMark804
Check my performance
t.me/GoldsignalMark804
My Channel link
t.me/GoldsignalMark804
Check my performance
Disclaimer
The information and publications are not meant to be, and do not constitute, financial, investment, trading, or other types of advice or recommendations supplied or endorsed by TradingView. Read more in the Terms of Use.