Evening Traders,
Today’s Technical Analysis – USDCAD – in a probable descending triangle formation, support and resistances are converging thus a breakout is imminent.
Points to consider,
- Trend bearish – consecutive lower highs
- Clear resistance line to breach
- Structural support being tested
- RSI diverging from price
- Stochastics projected down
- Volume Cleary declining
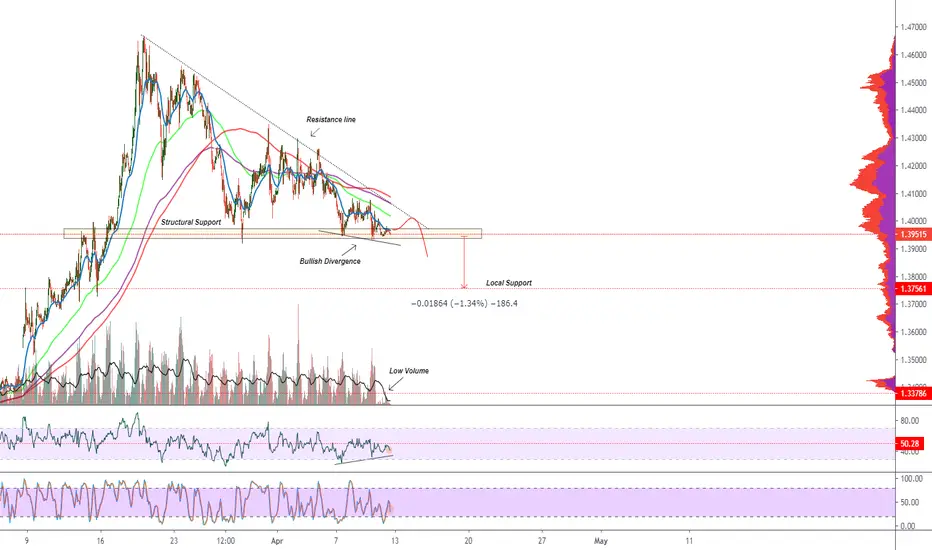
USDCAD’s immediate trend is bearish after putting in a local top – coincided from a break of key structural resistance in the lower regions of the chart. A break and close of this clear resistance line will negate the overall bearish formation.
Structural support is being tested, holding true, forming a bullish divergence, the RSI is putting in higher lows whilst price puts in lower lows. This is a sign that price might have strength to retest resistance again.
The stochastics is currently projected down, coinciding with the lower high projection; momentum is stored to the downside.
The volume is clearly declining, indication that an impulse move is imminent especially as price trades close to its apex.
Overall, in my opinion, USDCAD will have a breakout as support and resistances converge. A break down is more probable due to the bearish nature of the trend and formation.
What are your thoughts?
Please leave a like and comment,
And remember – Jesse Livermore once said,
“It took me five years to learn to play the game intelligently enough to make big money when I was right.”
Today’s Technical Analysis – USDCAD – in a probable descending triangle formation, support and resistances are converging thus a breakout is imminent.
Points to consider,
- Trend bearish – consecutive lower highs
- Clear resistance line to breach
- Structural support being tested
- RSI diverging from price
- Stochastics projected down
- Volume Cleary declining
USDCAD’s immediate trend is bearish after putting in a local top – coincided from a break of key structural resistance in the lower regions of the chart. A break and close of this clear resistance line will negate the overall bearish formation.
Structural support is being tested, holding true, forming a bullish divergence, the RSI is putting in higher lows whilst price puts in lower lows. This is a sign that price might have strength to retest resistance again.
The stochastics is currently projected down, coinciding with the lower high projection; momentum is stored to the downside.
The volume is clearly declining, indication that an impulse move is imminent especially as price trades close to its apex.
Overall, in my opinion, USDCAD will have a breakout as support and resistances converge. A break down is more probable due to the bearish nature of the trend and formation.
What are your thoughts?
Please leave a like and comment,
And remember – Jesse Livermore once said,
“It took me five years to learn to play the game intelligently enough to make big money when I was right.”
Join the Free Trading Group
Telegram: t.me/freetradingden 🔥
Unlock Blofin Bonuses
Trade with perks & support the community!
blofin.com/invite/alchemisttrader 🎁
Stay sharp, trade smart.
— Team The Alchemist ⚔️
Telegram: t.me/freetradingden 🔥
Unlock Blofin Bonuses
Trade with perks & support the community!
blofin.com/invite/alchemisttrader 🎁
Stay sharp, trade smart.
— Team The Alchemist ⚔️
Disclaimer
The information and publications are not meant to be, and do not constitute, financial, investment, trading, or other types of advice or recommendations supplied or endorsed by TradingView. Read more in the Terms of Use.