USDCAD is attempting to bounce back, supported by a stronger U.S. dollar index. The recent trade deals with Japan and the Eurozone have prompted traders to position more favorably toward the dollar. The sharp decline in EURUSD is also putting upward pressure on USDCAD.
This week will be crucial for both the U.S. and Canada, with a flood of economic data and major central bank events ahead. The Federal Reserve and the Bank of Canada are both expected to hold rates at tomorrow’s meetings. Although pressure from Trump is unlikely to sway FOMC members into a rate cut, the new trade deals do reduce policy uncertainty, which could increase the likelihood of a rate cut in September. Any minor hint of this scenario will likely be interpreted as dovish by the markets.
The Bank of Canada, in contrast, is expected to remain firmly dovish as tariffs continue to weigh heavily on growth. Meanwhile, Trump’s recent comments regarding Canadian tariffs are unlikely to boost economic confidence in Canada, although Carney is actively pushing for an improved trade agreement.
Aside from central bank meetings, both countries will release GDP data this week. Canada’s economy is expected to contract by 0.1% in May, with GDP figures arriving alongside employment change and the U.S. PCE report. A strong surprise from Canada could help limit the effect of the rising dollar index on USDCAD.
In the U.S., GDP, PCE, and payrolls data will make this one of the most unpredictable weeks for markets in recent months.
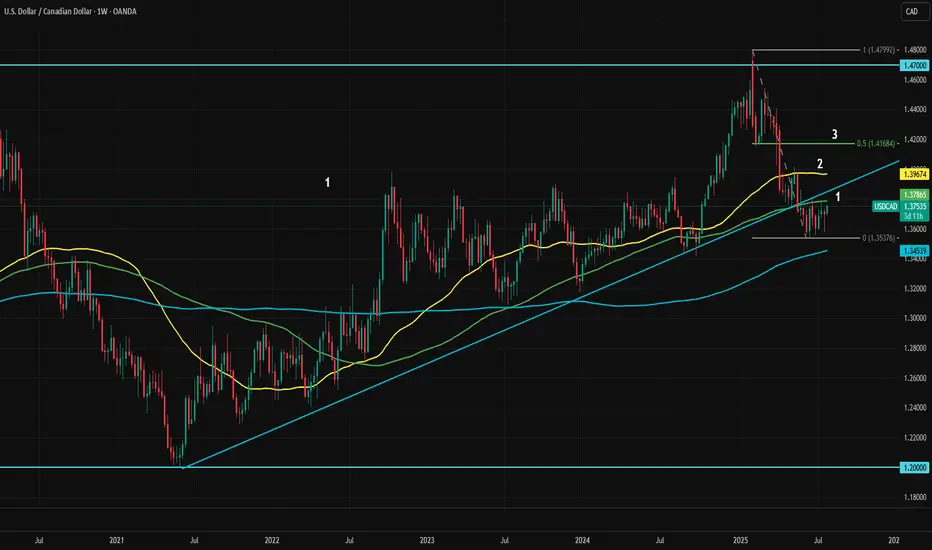
USDCAD is currently testing its 100-week moving average. The immediate resistance levels are 1.3786 and 1.3850, both marked as “1” in the chart as the first resistance area. If dollar index strength continues after the initial shock, the second resistance zone defined by the May top and the 50-week moving average will become the next target.
If dollar dominance persists in the medium term, the ultimate target would be 1.4170. This area is likely to act as strong resistance, as it includes the midpoint of the March to July pullback, the 23.6% Fibonacci retracement level of the 2021 to 2025 uptrend, and the February dip.
As long as this resistance holds, any upward moves can be considered potential selling opportunities. However, it remains uncertain which of the resistance levels will mark the top.
This week will be crucial for both the U.S. and Canada, with a flood of economic data and major central bank events ahead. The Federal Reserve and the Bank of Canada are both expected to hold rates at tomorrow’s meetings. Although pressure from Trump is unlikely to sway FOMC members into a rate cut, the new trade deals do reduce policy uncertainty, which could increase the likelihood of a rate cut in September. Any minor hint of this scenario will likely be interpreted as dovish by the markets.
The Bank of Canada, in contrast, is expected to remain firmly dovish as tariffs continue to weigh heavily on growth. Meanwhile, Trump’s recent comments regarding Canadian tariffs are unlikely to boost economic confidence in Canada, although Carney is actively pushing for an improved trade agreement.
Aside from central bank meetings, both countries will release GDP data this week. Canada’s economy is expected to contract by 0.1% in May, with GDP figures arriving alongside employment change and the U.S. PCE report. A strong surprise from Canada could help limit the effect of the rising dollar index on USDCAD.
In the U.S., GDP, PCE, and payrolls data will make this one of the most unpredictable weeks for markets in recent months.
USDCAD is currently testing its 100-week moving average. The immediate resistance levels are 1.3786 and 1.3850, both marked as “1” in the chart as the first resistance area. If dollar index strength continues after the initial shock, the second resistance zone defined by the May top and the 50-week moving average will become the next target.
If dollar dominance persists in the medium term, the ultimate target would be 1.4170. This area is likely to act as strong resistance, as it includes the midpoint of the March to July pullback, the 23.6% Fibonacci retracement level of the 2021 to 2025 uptrend, and the February dip.
As long as this resistance holds, any upward moves can be considered potential selling opportunities. However, it remains uncertain which of the resistance levels will mark the top.
Disclaimer
The information and publications are not meant to be, and do not constitute, financial, investment, trading, or other types of advice or recommendations supplied or endorsed by TradingView. Read more in the Terms of Use.
Disclaimer
The information and publications are not meant to be, and do not constitute, financial, investment, trading, or other types of advice or recommendations supplied or endorsed by TradingView. Read more in the Terms of Use.