Setup
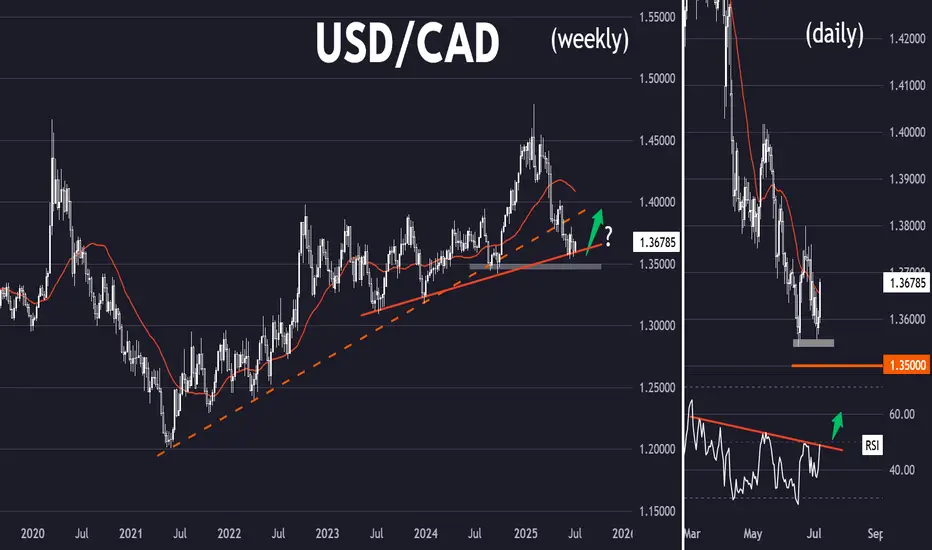
USD/CAD has broken below its long term uptrend line and is making lower lows while below the 30 week SMA, indicating a downtrend.
Signal
The daily chart shows a steep downtrend with RSI having twice been oversold at the May and June lows. However, on the most recent re-test of the lows RSI has held up. A double bottom pattern confirmed by a break back over 50 RSI could signal a more sustained bounce.
Signup to my newsletter:
tradingwriters.substack.com/
Market Analyst for:
WeTrade
wetradebroker.com/education/analysis/jasper/
SpreadEx
spreadex.com/financials
tradingwriters.substack.com/
Market Analyst for:
WeTrade
wetradebroker.com/education/analysis/jasper/
SpreadEx
spreadex.com/financials
Related publications
Disclaimer
The information and publications are not meant to be, and do not constitute, financial, investment, trading, or other types of advice or recommendations supplied or endorsed by TradingView. Read more in the Terms of Use.