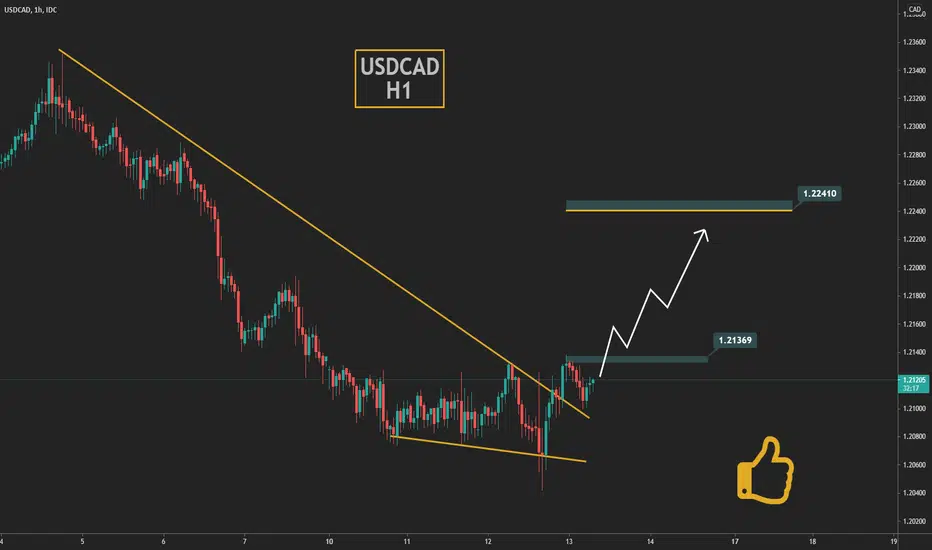
This is the hourly chart on USDCAD.
Here we can see that price broke outside of this H1 trend and if it goes above 1,2137 we will have a reversal.
This will confirm an upside direction and market reaching 1,2240.
At the same time we have a reversal candle on a Daily chart which also confirms this direction.
On a Monthly chart you can see that price is currently bouncing of a serious support.
✅ JOIN FREE TELEGRAM: t.me/trendlinefreetrade
❓ If you got questions: t.me/Semkov
💡 If you want to know on what basis we make our entries, get in here: t.me/trendlinefreetrade
❓ If you got questions: t.me/Semkov
💡 If you want to know on what basis we make our entries, get in here: t.me/trendlinefreetrade
Related publications
Disclaimer
The information and publications are not meant to be, and do not constitute, financial, investment, trading, or other types of advice or recommendations supplied or endorsed by TradingView. Read more in the Terms of Use.