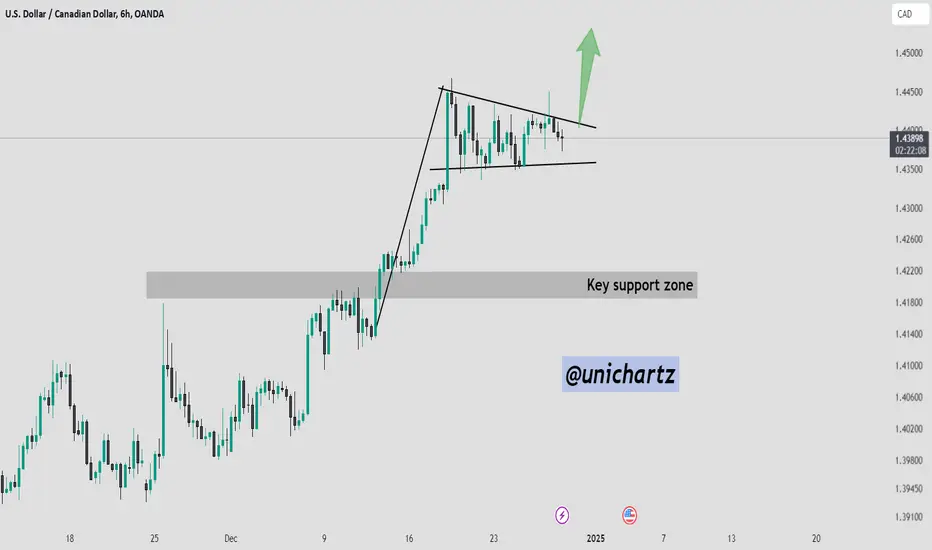
The USD/CAD 6-hour chart shows a bull flag pattern, a continuation setup that typically signals the resumption of the prior bullish trend.
Following a strong upward rally, the price has consolidated in a downward-sloping channel, characteristic of a bull flag.
A breakout above the resistance (~1.4410) would confirm the pattern, potentially driving the price higher toward the next target of 1.4500 or beyond.
Following a strong upward rally, the price has consolidated in a downward-sloping channel, characteristic of a bull flag.
A breakout above the resistance (~1.4410) would confirm the pattern, potentially driving the price higher toward the next target of 1.4500 or beyond.
Disclaimer
The information and publications are not meant to be, and do not constitute, financial, investment, trading, or other types of advice or recommendations supplied or endorsed by TradingView. Read more in the Terms of Use.
Disclaimer
The information and publications are not meant to be, and do not constitute, financial, investment, trading, or other types of advice or recommendations supplied or endorsed by TradingView. Read more in the Terms of Use.