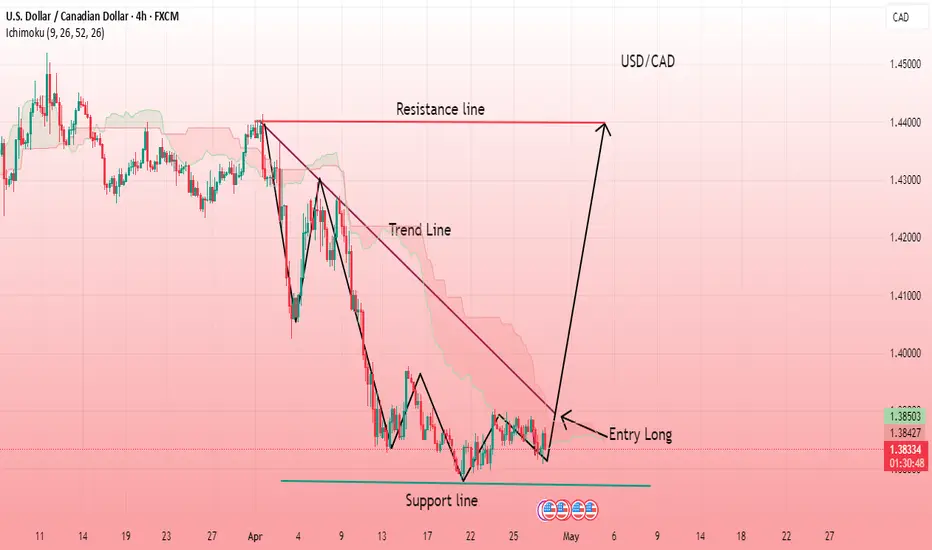
USD/CAD Technical Analysis
Chart Pattern: Trend Line Breakout Reversal
Target: 1.44000
1. Overall Market Structure
The chart depicts a clear downtrend, followed by sideways consolidation near a horizontal support line. A descending trend line captures the bearish structure, which has now been challenged by recent bullish momentum.
2. Support Zone & Rejection
The price has respected the support zone multiple times, forming a strong base.
Repeated bounces off this level suggest accumulation, where buyers are building positions.
3. Breakout Confirmation
Price action is attempting to break above the descending trend line, signaling a potential reversal from bearish to bullish.
The "Entry Long" point marks an ideal breakout zone, where traders could enter with confirmation (strong bullish candle close above the trend line).
4. Target Projection: 1.44000
The projected target is 1.44000, aligning with a major resistance level (previous structure highs).
This makes the trade a trend reversal play, aiming to capture the first major upward swing post-breakout .
5. Risk Management
A stop loss should be placed just below the support line or recent swing low to guard against a false breakout.
The trade offers a favorable risk-to-reward ratio, especially if entered on a retest of the breakout zone.
Trade active
Hold in buyJoin telegram channel free ..
t.me/GoldMan0009
Forex, Gold & Crypto Signals with detailed analysis & get consistent results..
Gold Signal's with proper TP & SL for high profit opportunities..
t.me/GoldMan0009
t.me/GoldMan0009
Forex, Gold & Crypto Signals with detailed analysis & get consistent results..
Gold Signal's with proper TP & SL for high profit opportunities..
t.me/GoldMan0009
Disclaimer
The information and publications are not meant to be, and do not constitute, financial, investment, trading, or other types of advice or recommendations supplied or endorsed by TradingView. Read more in the Terms of Use.
Join telegram channel free ..
t.me/GoldMan0009
Forex, Gold & Crypto Signals with detailed analysis & get consistent results..
Gold Signal's with proper TP & SL for high profit opportunities..
t.me/GoldMan0009
t.me/GoldMan0009
Forex, Gold & Crypto Signals with detailed analysis & get consistent results..
Gold Signal's with proper TP & SL for high profit opportunities..
t.me/GoldMan0009
Disclaimer
The information and publications are not meant to be, and do not constitute, financial, investment, trading, or other types of advice or recommendations supplied or endorsed by TradingView. Read more in the Terms of Use.