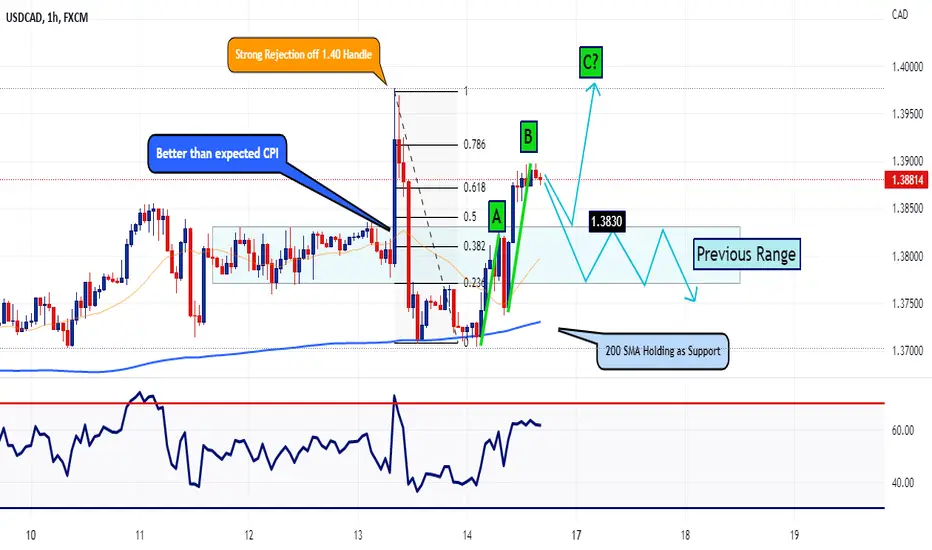
Most notably about the 1hr chart is that impulse "B" is greater than impulse "A" indicating strong bullish momentum still remains for further upside potential.
Knowing the fact we had a strong rejection following a test of just shy of the 1.40 handle, if price action is able to climb above that level, I would expect even further upside in the days ahead.
On the downside, before we see a possible impulse "C", I would expect at least a retracement back down towards the previous range of consolidation we had last week heading in the CPI report. This would mean a potential pullback towards 1.3830 - 1.3800. If we break below the 1.38 handle, I would be confident that an impulse "C" as illustrated on the chart won't be as likely.
The 1 hour chart did close out on Friday with a doji candle closing below the previous low.
Disclaimer
The information and publications are not meant to be, and do not constitute, financial, investment, trading, or other types of advice or recommendations supplied or endorsed by TradingView. Read more in the Terms of Use.
Disclaimer
The information and publications are not meant to be, and do not constitute, financial, investment, trading, or other types of advice or recommendations supplied or endorsed by TradingView. Read more in the Terms of Use.