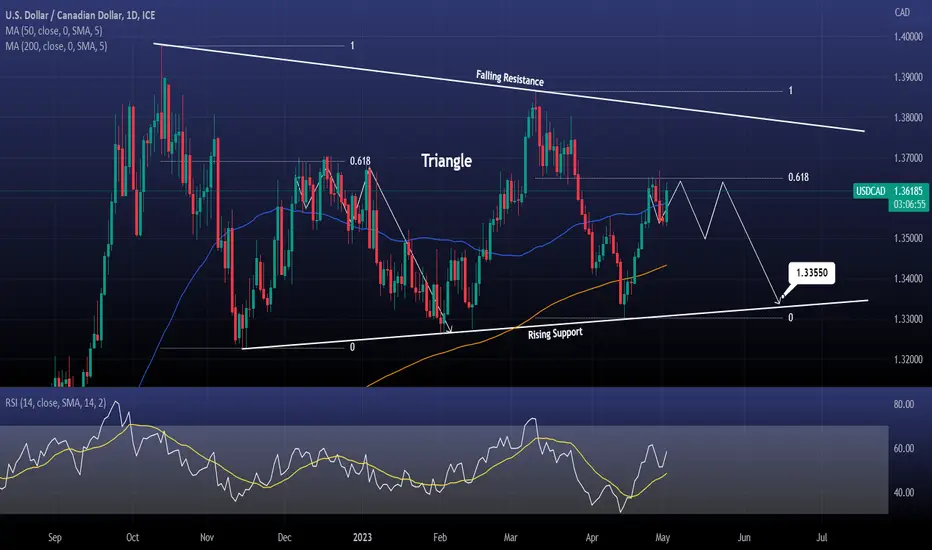
USDCAD is trading inside a Triangle with the price rising after it last hit the pattern's bottom (Rising Support).
It has failed to close over Fibonacci 0.618 on six straight days.
This failure is a technical sign of trend weakness, very much alike the struggle on Fibonacci 0.618 last December.
Sell and target the Rising Support again at 1.33550.
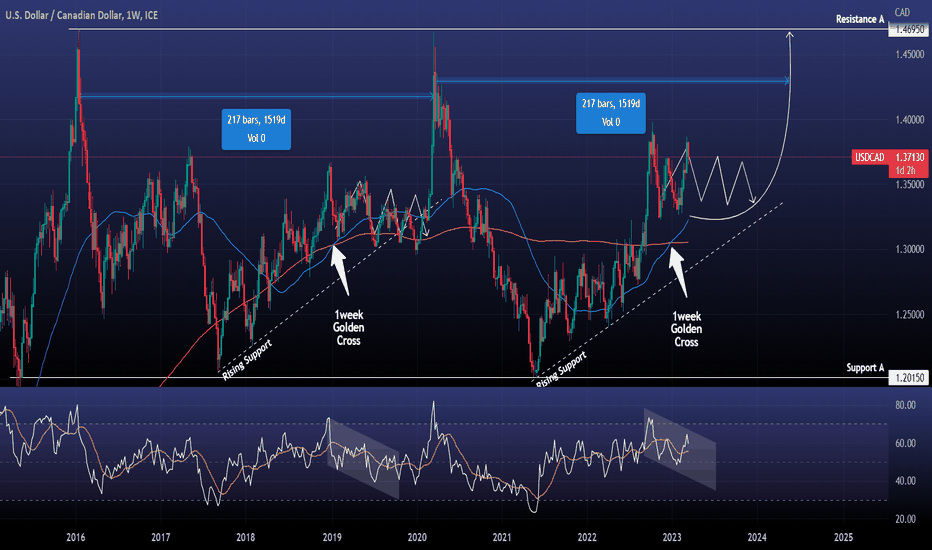
Previous chart:
Follow us, like the idea and leave a comment below!!
It has failed to close over Fibonacci 0.618 on six straight days.
This failure is a technical sign of trend weakness, very much alike the struggle on Fibonacci 0.618 last December.
Sell and target the Rising Support again at 1.33550.
Previous chart:
Follow us, like the idea and leave a comment below!!
TheCryptagon offers news & insights on global markets (crypto, forex, stocks, commodities). Follow so you don't miss anything!
🤑Message us for private forex & crypto signals in our VIP channel (70% accuracy)!💰
TELEGRAM: t.me/thecryptagon
🤑Message us for private forex & crypto signals in our VIP channel (70% accuracy)!💰
TELEGRAM: t.me/thecryptagon
Disclaimer
The information and publications are not meant to be, and do not constitute, financial, investment, trading, or other types of advice or recommendations supplied or endorsed by TradingView. Read more in the Terms of Use.