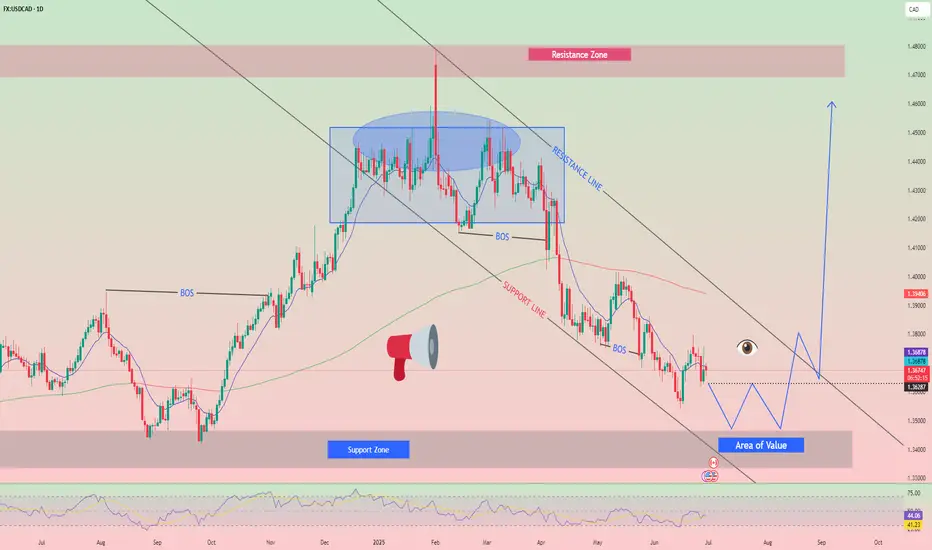
The downward wave that formed on the USD/CAD chart tis year has been followed by a corrective move since late May. The pair is largely confined to a sideways price channel. The current wave structure remains incomplete, lacking final segment.
Forecast:
The pair may decline further in the coming days, reaching the support zone. A reversal and upward movement from support may follow. The resistance zone reflects the upper boundary of the pair's expected weekly volatility.
Potential Reversal Zones
Resistance: 1.3800/ 1.3850
Support: 1.3640/ 1.3590
Recommendations:
Selling: Possible intraday in small volumes, not beyond the support zone.
Buying: Consider only after confirmed reversal signals appear near support.
DAILY FREE SIGNAL. FREE SIGNAL (95% accuracy) TP AND SL PROVIDED
In This Channel, i Will Provide you a profitable Scalping And Swing Trade Follow My Signals
PUBLIC TELEGRAM CHANNEL
t.me/CEO_PREMIUM_ANALYSIS
In This Channel, i Will Provide you a profitable Scalping And Swing Trade Follow My Signals
PUBLIC TELEGRAM CHANNEL
t.me/CEO_PREMIUM_ANALYSIS
Disclaimer
The information and publications are not meant to be, and do not constitute, financial, investment, trading, or other types of advice or recommendations supplied or endorsed by TradingView. Read more in the Terms of Use.