this is the updated analysis on USDCAD.
in my last trading idea, I was looking for a bearish violation of a neckline of H&S pattern.
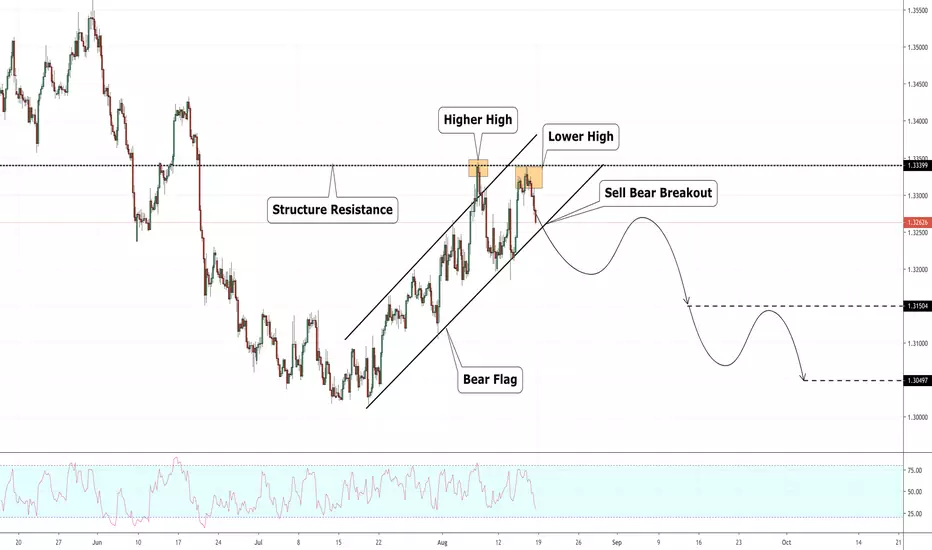
now the pattern is invalid, but the market has set the lower high.
Again, it is a very good indication of a weakening bullish momentum.
Your plan for next week:
Wait and sell bearish breakout of a bear flag.
T1 - 1.315
T2 - 1.305
(previous analysis on usdcad below in related ideas)
✅Join My Telegram Channel: t.me/VasilyTrading
❗️YouTube Channel youtube.com/c/VasilyTrader
✅ Facebook: facebook.com/VasilyTrading/
⭐ My Forex & Gold Broker: bit.ly/vasilyforexbroker ⭐
❗️YouTube Channel youtube.com/c/VasilyTrader
✅ Facebook: facebook.com/VasilyTrading/
⭐ My Forex & Gold Broker: bit.ly/vasilyforexbroker ⭐
Related publications
Disclaimer
The information and publications are not meant to be, and do not constitute, financial, investment, trading, or other types of advice or recommendations supplied or endorsed by TradingView. Read more in the Terms of Use.