USD/CAD
Timeframe: 30-Minute Chart
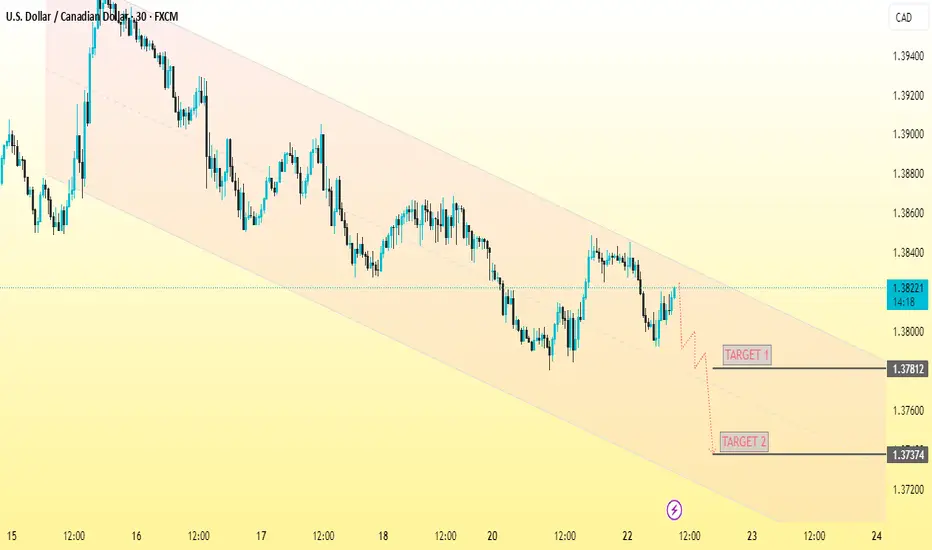
Trend: Bearish (within a descending channel)
---
Entry Point:
Entry Price: 1.38192 (current market price marked on chart)
---
Take Profit Targets:
TP1: 1.37812 (labeled "TARGET 1")
Final TP (TP2): 1.37374 (labeled "TARGET 2")
---
Support Levels:
1.37812 – First major support level (TP1)
1.37374 – Second strong support level (TP2, previous structure low)
---
Resistance Levels:
1.38192 – Current entry zone and minor resistance (short-term reaction level)
1.38400 - 1.38500 – Mid-channel resistance area
1.38700+ – Upper trendline resistance (from channel)
---
Chart Structure:
Descending Channel: Price is respecting a downward sloping parallel channel.
Bearish Momentum: Lower highs and lower lows.
Entry at Pullback: Entry aligns with a pullback to channel mid-zone.
---
Suggested Caption to Share with Your Client:
> USD/CAD Trade Setup (30-Min Chart):
Price is trending inside a descending channel.
Entry: 1.38192
TP1: 1.37812
Final TP: 1.37374
Trend: Bearish
Expecting continuation to downside after pullback.
Key Resistance: 1.38400–1.38700
Key Support: 1.37812, 1.37374
Watch for bearish confirmation at entry level before executing.
Timeframe: 30-Minute Chart
Trend: Bearish (within a descending channel)
---
Entry Point:
Entry Price: 1.38192 (current market price marked on chart)
---
Take Profit Targets:
TP1: 1.37812 (labeled "TARGET 1")
Final TP (TP2): 1.37374 (labeled "TARGET 2")
---
Support Levels:
1.37812 – First major support level (TP1)
1.37374 – Second strong support level (TP2, previous structure low)
---
Resistance Levels:
1.38192 – Current entry zone and minor resistance (short-term reaction level)
1.38400 - 1.38500 – Mid-channel resistance area
1.38700+ – Upper trendline resistance (from channel)
---
Chart Structure:
Descending Channel: Price is respecting a downward sloping parallel channel.
Bearish Momentum: Lower highs and lower lows.
Entry at Pullback: Entry aligns with a pullback to channel mid-zone.
---
Suggested Caption to Share with Your Client:
> USD/CAD Trade Setup (30-Min Chart):
Price is trending inside a descending channel.
Entry: 1.38192
TP1: 1.37812
Final TP: 1.37374
Trend: Bearish
Expecting continuation to downside after pullback.
Key Resistance: 1.38400–1.38700
Key Support: 1.37812, 1.37374
Watch for bearish confirmation at entry level before executing.
Disclaimer
The information and publications are not meant to be, and do not constitute, financial, investment, trading, or other types of advice or recommendations supplied or endorsed by TradingView. Read more in the Terms of Use.
Disclaimer
The information and publications are not meant to be, and do not constitute, financial, investment, trading, or other types of advice or recommendations supplied or endorsed by TradingView. Read more in the Terms of Use.