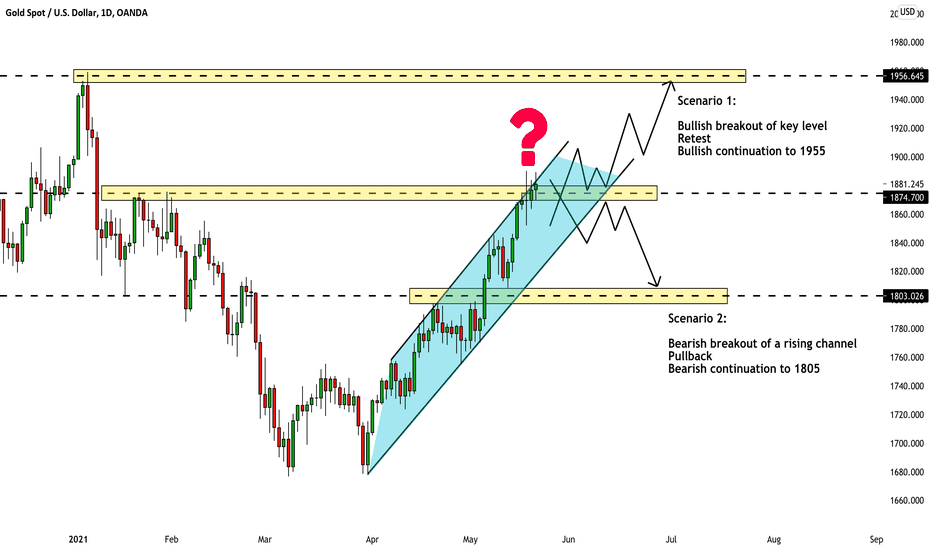
USDCAD: Detailed Analysis & Bullish Scenario Explained 🇺🇸🇨🇦
USDCAD is testing an upper boundary of a key weekly pivot.
Based on a historical structure analysis,
1.19 - 1.207 is a huge potential reversal zone.
To catch the initiation of a bullish trend,
pay attention to a falling trend line on a daily that currently matches the lower highs.
Only after a violation of that trend line, we can become bullish biased.
For now, I would not recommend USDCAD for intraday trading.
❤️Please, support this idea with a like and comment!❤️
⬇️Subscribe to my social networks!⬇️
✅Join My Telegram Channel: t.me/VasilyTrading
❗️YouTube Channel youtube.com/c/VasilyTrader
✅ Facebook: facebook.com/VasilyTrading/
⭐ My Forex & Gold Broker: bit.ly/vasilyforexbroker ⭐
❗️YouTube Channel youtube.com/c/VasilyTrader
✅ Facebook: facebook.com/VasilyTrading/
⭐ My Forex & Gold Broker: bit.ly/vasilyforexbroker ⭐
Related publications
Disclaimer
The information and publications are not meant to be, and do not constitute, financial, investment, trading, or other types of advice or recommendations supplied or endorsed by TradingView. Read more in the Terms of Use.
