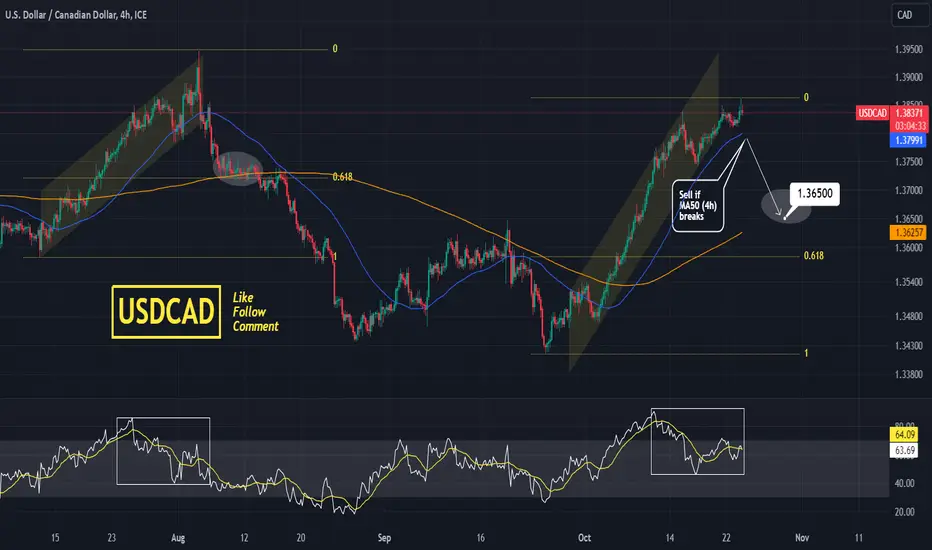
USDCAD is on a continuous rise since the September 24 low inside a Channel Up.
The pattern however broke this week sideways and is already showing the first signs of exhaustion as the RSI (4h) is printing a topping pattern similar to August 5th.
Still though, the MA50 (4h) is supporting.
Trading Plan:
1. Sell if the price crosses below the MA50 (4h).
Targets:
1. 1.36500 (potential contact with the MA200 (4h)).
Tips:
1. The August fractal started to decline just after the RSI formed this pattern. I may have found the first support base on the 0.618 Fibonacci level but that happened to be on the MA200 (4h) as well and that is why we pursue this as target.
Please like, follow and comment!!
Join our private Telegram signals channel, with +70% accuracy for forex and crypto! 🎉
Also doing account management, earn +15% monthly profit!
👉CONTACT: t.me/tradingbrokersview
Stop gambling with your trades! 🎰
Start being profitable! 💰
Also doing account management, earn +15% monthly profit!
👉CONTACT: t.me/tradingbrokersview
Stop gambling with your trades! 🎰
Start being profitable! 💰
Disclaimer
The information and publications are not meant to be, and do not constitute, financial, investment, trading, or other types of advice or recommendations supplied or endorsed by TradingView. Read more in the Terms of Use.