SMC trading point update
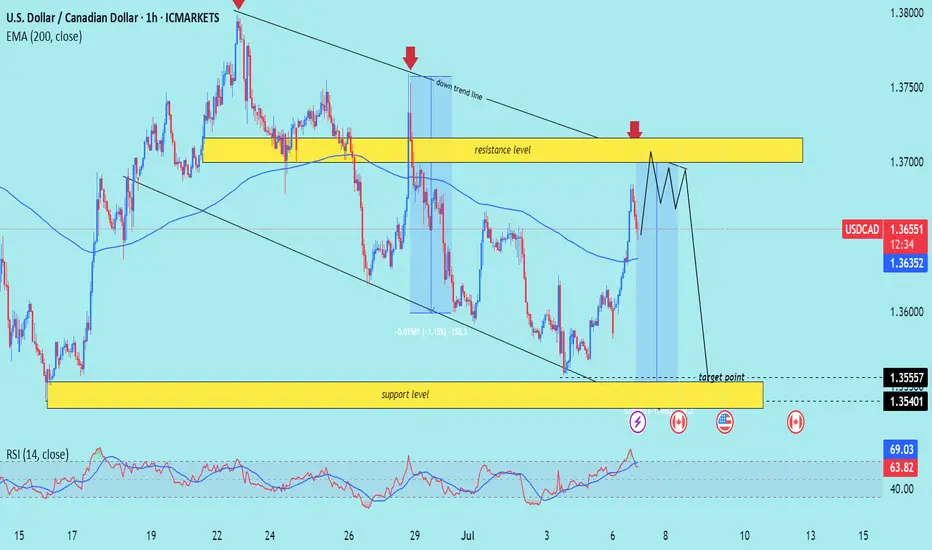
Technical analysis of USD/CAD (U.S. Dollar / Canadian Dollar) on the 1-hour timeframe, with a focus on a potential double-top formation at strong resistance, followed by a drop toward support:
---
Analysis Overview
Trend Structure: Downward-sloping channel with lower highs and lower lows.
Confluence Area: The current rally is approaching both the upper channel boundary and a significant horizontal resistance zone (~1.3660–1.3700).
---
Key Technical Elements
1. Resistance & Double-Top Setup
The price nears the resistance zone (yellow) where it previously reversed (noted by red arrows).
A cap-and-float pattern (double/top-like structure) is projected: price pushes higher, hesitates, tests resistance again, then fails—a sign of weakening bullish momentum.
2. EMA 200 Interaction
The 1-hour EMA 200 (blue line at ~1.3635) sits just below current price.
A failure to sustain above this level reinforces the bearish case.
3. RSI Overextension
RSI (14) is around 64–69, indicating near-overbought conditions on this timeframe, suggesting a potential pullback.
4. Price Targets
Initial target: Lower channel boundary near 1.3556 (highlighted support).
Extended target: Beneath to 1.3540, aligning with the broader Demand zone.
---
Proposed Trade Setup
Step Action Level
Entry Short near top of resistance/channel (after double-top confirmation) 1.3680–1.3700
Stop-Loss Above recent high and channel resistance ~1.3720
Take Profit 1 Near EMA 200/lower channel bounce ~1.3556
Take Profit 2 Extended move to demand zone ~1.3540
Estimated Move ~1.15% drop from midday highs –
---
Risk & Event Factors
Scheduled Canadian or U.S. data releases (icons shown) could introduce volatility and disrupt technical patterns.
A breakout above ~1.3720 would invalidate this bearish thesis and shift bias bullish.
Mr SMC Trading point
---
Summary
Expecting a cap-and-float double-top formation at key resistance near 1.3660–1.3700, followed by a trend continuation drop toward 1.3556–1.3540. The bearish setup is supported by a down-channel structure, EMA 200 failure, and overbought RSI conditions.
Please support boost 🚀 this analysis)
Trade active
(Services:✔️ JOIN Telegram channel
t.me/SMCTrading_point
Gold trading signals 🚀 99%
t.me/SMCTrading_point
Join my recommended broker , link 👇
World best broker exness ✅D
one.exnesstrack.org/a/l1t1rf3p6v
t.me/SMCTrading_point
Gold trading signals 🚀 99%
t.me/SMCTrading_point
Join my recommended broker , link 👇
World best broker exness ✅D
one.exnesstrack.org/a/l1t1rf3p6v
Related publications
Disclaimer
The information and publications are not meant to be, and do not constitute, financial, investment, trading, or other types of advice or recommendations supplied or endorsed by TradingView. Read more in the Terms of Use.