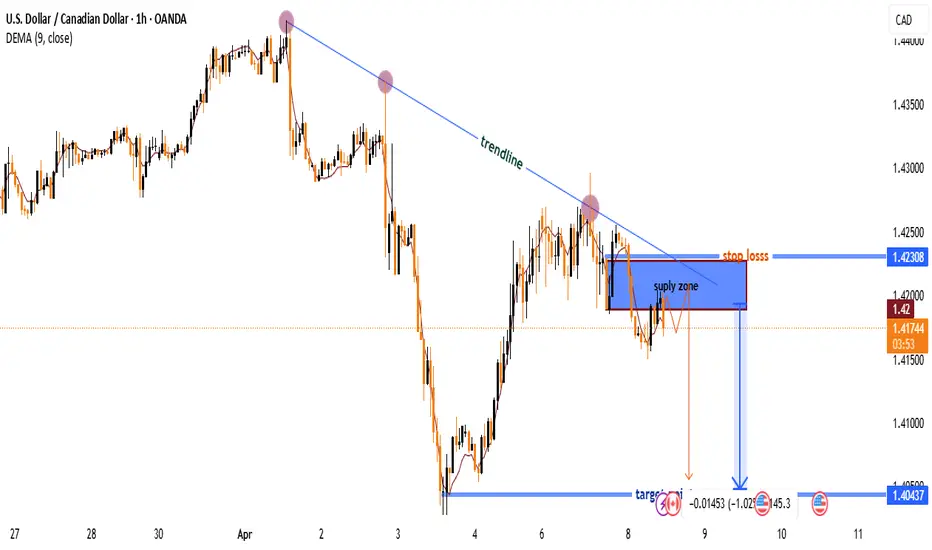
📉 Trendline & Market Structure
🔵 Descending Trendline: The price has respected this trendline multiple times (🔴 red dots mark rejection points). This confirms a bearish structure.
📦 Supply Zone (Sell Area)
🟦 Blue Zone (Supply Zone): This is a strong resistance area where sellers may push the price down.
🚀 Price Rejected Here: Market reaction suggests potential bearish momentum.
⚠️ Stop Loss & Target 🎯
❌ Stop Loss (1.42308): If the price breaks above, the bearish setup is invalid.
🎯 Target (1.40437): Marked with a blue arrow 📉 indicating a downward move.
✅ Trade Plan
🔽 Sell Entry: Inside the supply zone
🛑 Stop Loss: Above the supply zone
🎯 Take Profit: At the lower blue level
This setup suggests a high-risk reward ratio favoring short positions. 📊 Keep an eye on the trendline and market reaction!
join my tellegram channel
t.me/JaMesGoldFiGhteR786
join my refferal broker
xmglobal.com/referral?token=S4yGyqPUmU9uAANtb_YUoA
t.me/JaMesGoldFiGhteR786
join my refferal broker
xmglobal.com/referral?token=S4yGyqPUmU9uAANtb_YUoA
Disclaimer
The information and publications are not meant to be, and do not constitute, financial, investment, trading, or other types of advice or recommendations supplied or endorsed by TradingView. Read more in the Terms of Use.