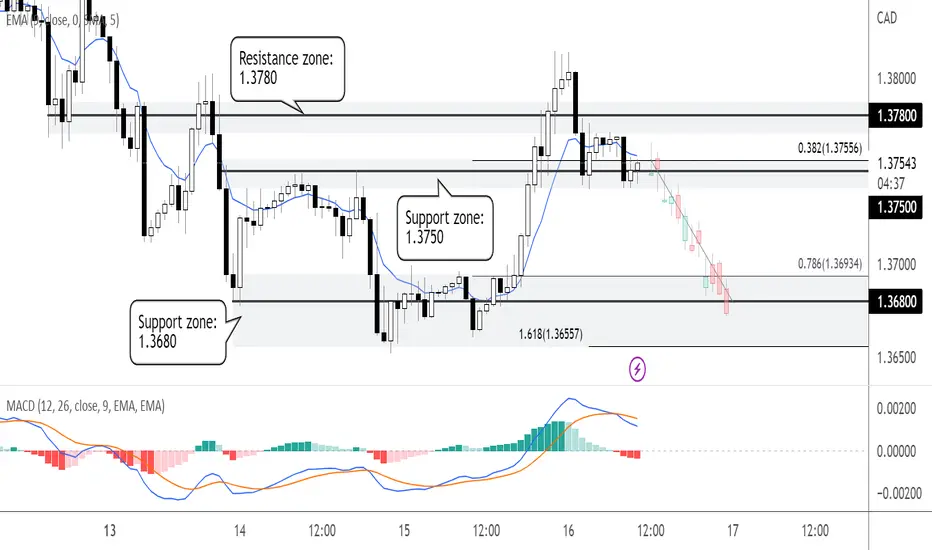
Prices are testing a key support zone at 1.3750 on the H1 timeframe, which coincides with the 38.2% Fibonacci retracement. A break below the zone could provide the bearish acceleration to the next support zone at 1.3680, in line with the 78.6% Fibonacci retracement and 161.8% Fibonacci extension. Failure to break below the support zone could see price bounce to the resistance zone at 1.3780. Prices are holding below the 20 EMA, while MACD is showing bearish momentum, supporting our bearish bias.
Disclaimer
The information and publications are not meant to be, and do not constitute, financial, investment, trading, or other types of advice or recommendations supplied or endorsed by TradingView. Read more in the Terms of Use.
Disclaimer
The information and publications are not meant to be, and do not constitute, financial, investment, trading, or other types of advice or recommendations supplied or endorsed by TradingView. Read more in the Terms of Use.