Your chart on USD/CAD (15-minute timeframe) clearly shows a bearish breakdown from the ascending trendline, and here’s a quick analysis based on what you’ve marked:
---
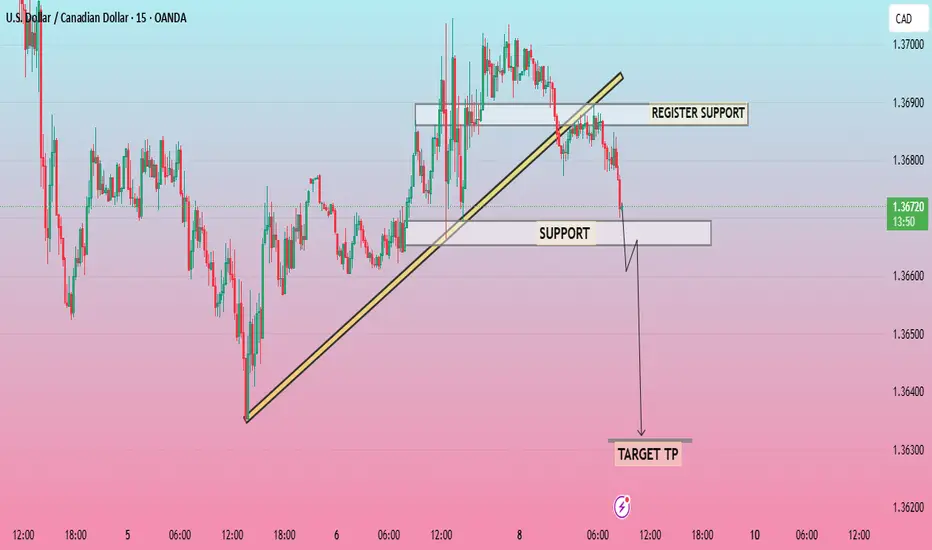
📉 Technical Breakdown
🔻 Trendline Broken: Price has broken below the ascending trendline, indicating loss of bullish momentum.
🧱 Register Support (turned resistance): Price rejected after testing this area – confirms a bearish flip.
🧭 Support Zone (gray box): Price is currently testing this level. If it breaks below, continuation to TP is likely.
🎯 Target TP: Marked around 1.3625–1.3630, showing good confluence with prior swing lows.
---
✅ Bearish Bias Confirmation
This looks like a textbook setup:
Break of trendline ✅
Retest of broken support (now resistance) ✅
---
📉 Technical Breakdown
🔻 Trendline Broken: Price has broken below the ascending trendline, indicating loss of bullish momentum.
🧱 Register Support (turned resistance): Price rejected after testing this area – confirms a bearish flip.
🧭 Support Zone (gray box): Price is currently testing this level. If it breaks below, continuation to TP is likely.
🎯 Target TP: Marked around 1.3625–1.3630, showing good confluence with prior swing lows.
---
✅ Bearish Bias Confirmation
This looks like a textbook setup:
Break of trendline ✅
Retest of broken support (now resistance) ✅
Trade active
TRADE ACTIVE TARGET TP HIT𝗪𝗲 𝗮𝗿𝗲 𝗰𝗼𝗻𝗾𝘂𝗲𝗿 𝗚𝗼𝗹𝗱 𝗮𝗻𝗱 𝗖𝘂𝗿𝗿𝗲𝗻𝗰𝘆 𝗶𝗻 𝘁𝗿𝗮𝗱𝗶𝗻𝗴 🏅
t.me/en9RPKZCAzs5ZjNk
𝗦𝗶𝗿 𝗠𝗜𝗥👨✈️𝗧𝗵𝗲 𝗯𝗲𝘀𝘁 𝘀𝗰𝗮𝗹𝗽𝗶𝗻𝗴 𝘀𝗶𝗴𝗻𝗮𝗹 𝗽𝗿𝗼𝘃𝗶𝗱𝗲𝗿! 🌍
t.me/en9RPKZCAzs5ZjNk
t.me/en9RPKZCAzs5ZjNk
𝗦𝗶𝗿 𝗠𝗜𝗥👨✈️𝗧𝗵𝗲 𝗯𝗲𝘀𝘁 𝘀𝗰𝗮𝗹𝗽𝗶𝗻𝗴 𝘀𝗶𝗴𝗻𝗮𝗹 𝗽𝗿𝗼𝘃𝗶𝗱𝗲𝗿! 🌍
t.me/en9RPKZCAzs5ZjNk
Disclaimer
The information and publications are not meant to be, and do not constitute, financial, investment, trading, or other types of advice or recommendations supplied or endorsed by TradingView. Read more in the Terms of Use.
𝗪𝗲 𝗮𝗿𝗲 𝗰𝗼𝗻𝗾𝘂𝗲𝗿 𝗚𝗼𝗹𝗱 𝗮𝗻𝗱 𝗖𝘂𝗿𝗿𝗲𝗻𝗰𝘆 𝗶𝗻 𝘁𝗿𝗮𝗱𝗶𝗻𝗴 🏅
t.me/en9RPKZCAzs5ZjNk
𝗦𝗶𝗿 𝗠𝗜𝗥👨✈️𝗧𝗵𝗲 𝗯𝗲𝘀𝘁 𝘀𝗰𝗮𝗹𝗽𝗶𝗻𝗴 𝘀𝗶𝗴𝗻𝗮𝗹 𝗽𝗿𝗼𝘃𝗶𝗱𝗲𝗿! 🌍
t.me/en9RPKZCAzs5ZjNk
t.me/en9RPKZCAzs5ZjNk
𝗦𝗶𝗿 𝗠𝗜𝗥👨✈️𝗧𝗵𝗲 𝗯𝗲𝘀𝘁 𝘀𝗰𝗮𝗹𝗽𝗶𝗻𝗴 𝘀𝗶𝗴𝗻𝗮𝗹 𝗽𝗿𝗼𝘃𝗶𝗱𝗲𝗿! 🌍
t.me/en9RPKZCAzs5ZjNk
Disclaimer
The information and publications are not meant to be, and do not constitute, financial, investment, trading, or other types of advice or recommendations supplied or endorsed by TradingView. Read more in the Terms of Use.