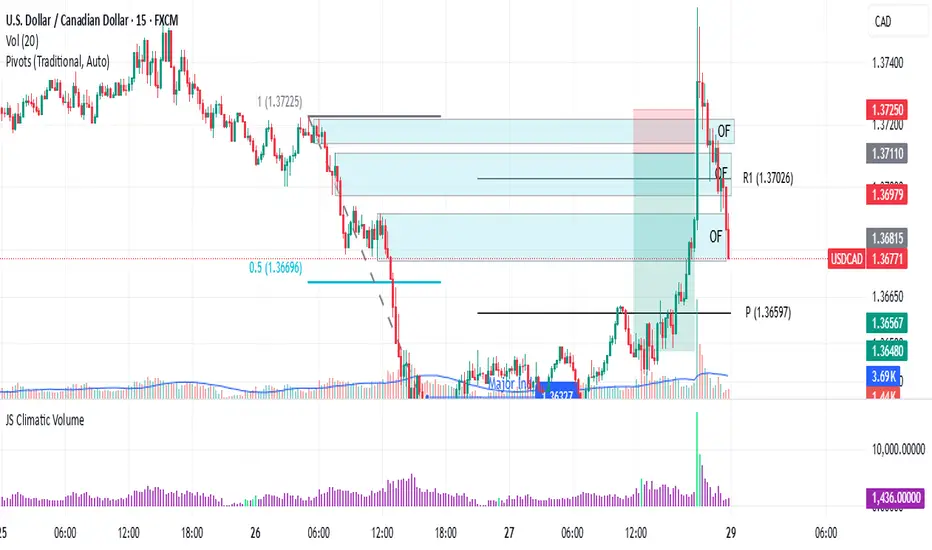
Every trader knows the frustration: your analysis is technically flawless, but the market moves against you. I learned this brutally in Q1 2024 when my USD/CAD short—backed by textbook bearish divergence and order block rejection—got steamrolled by a 190-pip rally after Canada’s surprise oil export announcement.
The Blind Spot in Pure Technicals
Price action traders often dismiss fundamentals as "noise," but three scenarios consistently break chart-based systems:
Policy Surprises (SNB removing EUR/CHF floor)
Geopolitical Shocks (Rubles during Ukraine invasion)
Structural Shifts (BOJ abandoning YCC)
These events share one trait: they change the market’s fundamental DNA, invalidating historical patterns.
A Practical Filter
I need to train myself to do something like this: To overlay two fundamental checks before technical entries:
Central Bank Calendar
No trades 12 hours before scheduled meetings
Monitor yield spreads (10YR US vs. DE)
Commodity Links
AUD/USD: Iron ore inventories
USD/CAD: WTI backwardation
Case Study: April 2024 GBP/USD
Technicals suggested continuation above 1.2700
Fundamental red flag: UK real wages shrinking
Outcome: False breakout, 140-pip drop
Your Turn
Try this today: On your next trade, ask:
Is there scheduled event risk?
Does this align with rate expectations?
Are commodities/equities confirming?
The goal isn’t perfection—it’s avoiding obvious mismatches.
For me, I read my own words on what should be done, and most probably, I won't do it. I think the above is too much. I believe there must be an easier way to merge Technical and Fundamental Analysis.
Related publications
Disclaimer
The information and publications are not meant to be, and do not constitute, financial, investment, trading, or other types of advice or recommendations supplied or endorsed by TradingView. Read more in the Terms of Use.
Related publications
Disclaimer
The information and publications are not meant to be, and do not constitute, financial, investment, trading, or other types of advice or recommendations supplied or endorsed by TradingView. Read more in the Terms of Use.