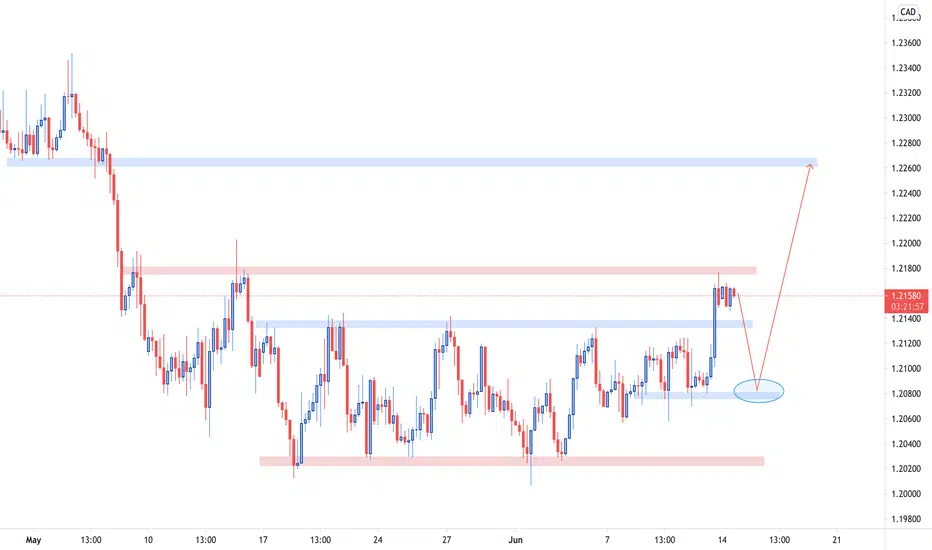
As it can be inferred from the bigger timeframe charts, the price may potentially reverse and continue growing to the upside. The price printed a very strong bullish candle last Friday and broke the zone of resistance identified on the graph. It will keep growing again, but we need a decent pullback for that. We are expecting the price to drop till the area plotted on the chart before continuing to rise and reach the 1.226 zone of resistance which once was a zone of support.
Disclaimer
The information and publications are not meant to be, and do not constitute, financial, investment, trading, or other types of advice or recommendations supplied or endorsed by TradingView. Read more in the Terms of Use.
Disclaimer
The information and publications are not meant to be, and do not constitute, financial, investment, trading, or other types of advice or recommendations supplied or endorsed by TradingView. Read more in the Terms of Use.