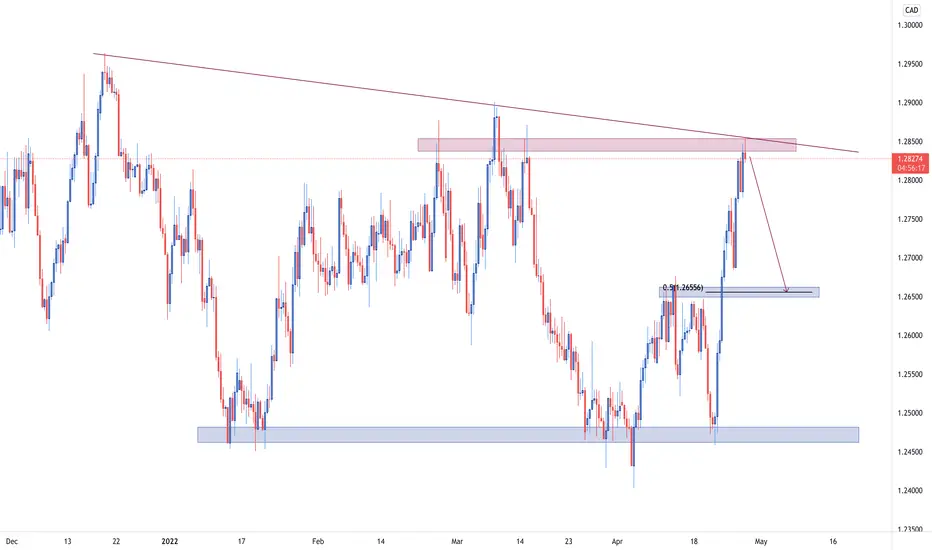
Taking a look at higher timeframe charts, we can observe that a descending triangle pattern is being formed. Further to that, the price is currently showing some bearish confirmations around the zone of local resistance. We can expect for the price to keep dropping and reach the zone of previous resistance later turned support that lines up with 50% Fibonacci retracement level.
Disclaimer
The information and publications are not meant to be, and do not constitute, financial, investment, trading, or other types of advice or recommendations supplied or endorsed by TradingView. Read more in the Terms of Use.
Disclaimer
The information and publications are not meant to be, and do not constitute, financial, investment, trading, or other types of advice or recommendations supplied or endorsed by TradingView. Read more in the Terms of Use.