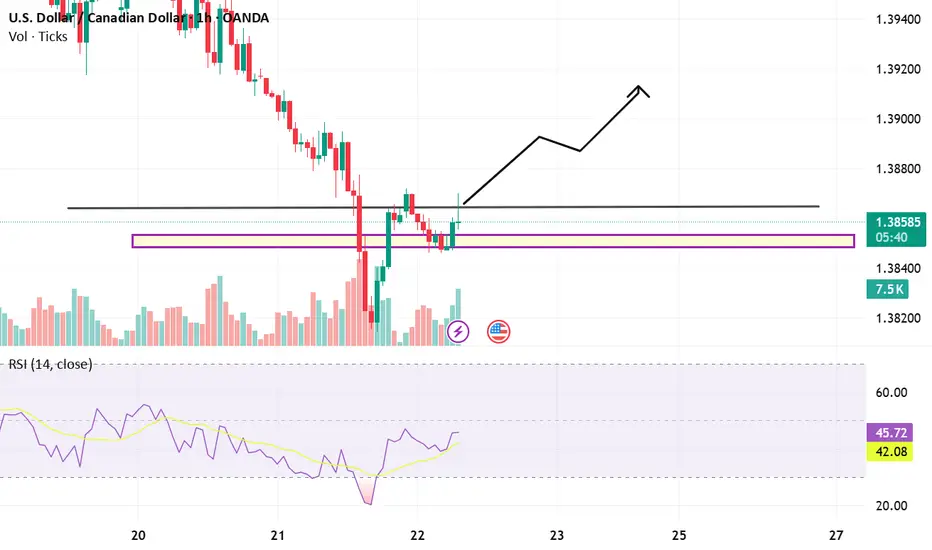
The pair attempting a recovery following a sharp bearish decline. After a significant selloff, price found strong support in the 1.38300–1.38440 zone, where multiple rejections indicate the presence of demand. This area has now acted as a base for a bullish reaction, confirmed by increasing bullish volume on the most recent candles.
The recovery is now pushing back toward a previously broken structure zone around 1.38770–1.38800, which is expected to act as resistance. This is a critical level to watch, as it previously marked a breakdown point. If price manages to push above and hold, it could signal a reversal or at least a corrective rally within the broader downtrend.
Momentum indicators are showing early signs of recovery. The RSI has climbed to around 46, rebounding from a low and crossing its moving average. While it remains below the neutral 50 level—still slightly favoring sellers—the upward momentum is strengthening. This supports the current short-term bullish movement, especially if price remains above the 1.3840 handle.
The short-term trend is shifting toward bullish, supported by a potential higher low structure forming after the recent dip. A clean break and hold above 1.3880 could open the door for a move toward the psychological round number at 1.3900 and potentially higher toward 1.3920–1.3940.
However, if the price fails to hold above 1.3840 and breaks back into the support box with bearish volume, the recovery thesis would be invalidated, suggesting a potential revisit of the 1.3820 level and lower.
In summary, the chart suggests a cautious bullish bias with near-term upside potential, contingent on maintaining support above the demand zone and breaking through the resistance around 1.3880 with momentum.
Disclaimer
The information and publications are not meant to be, and do not constitute, financial, investment, trading, or other types of advice or recommendations supplied or endorsed by TradingView. Read more in the Terms of Use.
Disclaimer
The information and publications are not meant to be, and do not constitute, financial, investment, trading, or other types of advice or recommendations supplied or endorsed by TradingView. Read more in the Terms of Use.