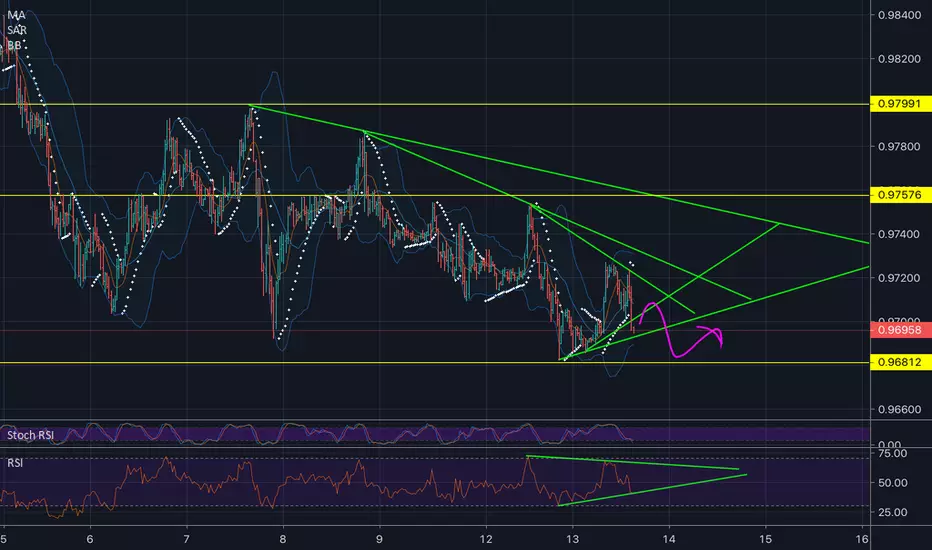
It seems that value is breaking one support line downwards. First target will be 0,969 and than 0,968. Parabolic SAR and moving average looks like supporting the down movement.
We also have to check the RSI side as well, if it will break the support line. Also bollinger bands does not show a signal for steep move as well. It may be small downfall and than a reaction from support and some horizontal movements.
We also have to check the RSI side as well, if it will break the support line. Also bollinger bands does not show a signal for steep move as well. It may be small downfall and than a reaction from support and some horizontal movements.
Trade closed: target reached
Our ascending triangle worked very well. Movement times are not perfect but support and resistance trends worked perfectly. In the movement, there were fake stops as well.Disclaimer
The information and publications are not meant to be, and do not constitute, financial, investment, trading, or other types of advice or recommendations supplied or endorsed by TradingView. Read more in the Terms of Use.
Disclaimer
The information and publications are not meant to be, and do not constitute, financial, investment, trading, or other types of advice or recommendations supplied or endorsed by TradingView. Read more in the Terms of Use.