# USDCHF Technical Analysis & Forecast
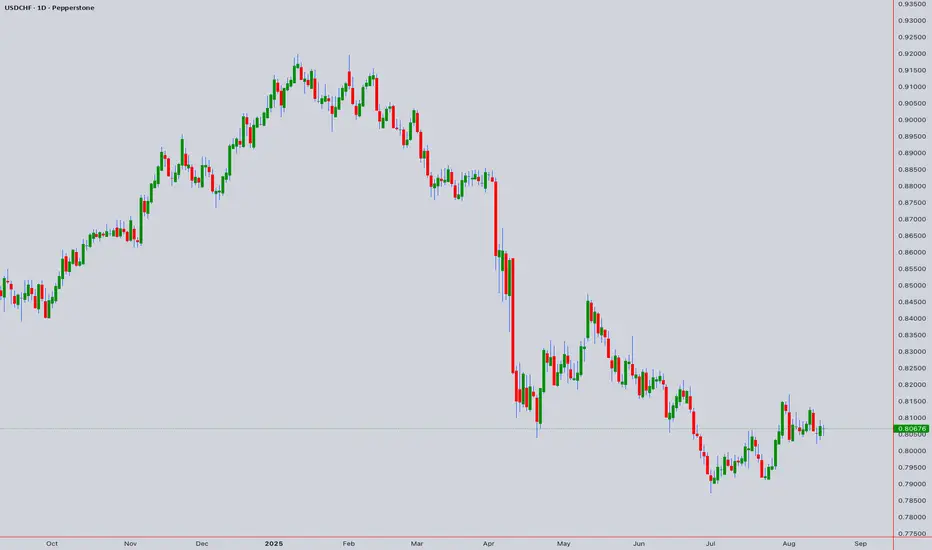
**Base Price:** 0.80676 (August 15, 2025)
## Executive Summary
The USDCHF pair at 0.80676 presents a critical juncture with multiple technical confluences suggesting potential directional moves across various timeframes.
## Japanese Candlestick Analysis
### Intraday Patterns (5M-1H)
- **Key Reversal Patterns:** Look for Doji, Hammer, or Shooting Star formations around psychological levels
- **Continuation Patterns:** Marubozu candles indicating strong momentum
- **Support/Resistance:** 0.8050, 0.8080, 0.8100 as key levels
### Swing Patterns (4H-Monthly)
- **Engulfing Patterns:** Critical at weekly open/close levels
- **Evening/Morning Star:** Watch for three-candle reversals at major S/R
- **Harami Patterns:** Indicating potential consolidation phases
## Harmonic Pattern Analysis
### M & W Patterns
- **M-Top Formation:** Potential resistance around 0.8120-0.8150 zone
- **W-Bottom:** Support confluence near 0.7980-0.8020 region
- **Neckline:** Critical break levels at 0.8065 and 0.8085
### ABCD Patterns
- **Bullish ABCD:** Target projection to 0.8180-0.8220
- **Bearish ABCD:** Downside target 0.7920-0.7950
- **Extension Ratios:** 127.2%, 161.8%, 200% Fibonacci extensions
## Elliott Wave Analysis
### Wave Structure
- **Current Position:** Likely in Wave 4 correction of larger impulse
- **Wave 5 Target:** 0.8250-0.8300 for bullish completion
- **Alternative Count:** ABC correction with C-wave target 0.7850
### Time Projections
- **Intraday:** 2-4 hour wave cycles
- **Swing:** 5-8 day wave completions
- **Primary:** 3-5 week major wave cycles
## Wyckoff Analysis
### Market Phases
- **Accumulation Zone:** 0.7980-0.8050
- **Distribution Zone:** 0.8150-0.8250
- **Spring Test:** Watch for false breaks below 0.8000
- **Upthrust:** Potential fake breaks above 0.8200
### Volume Analysis
- **Climactic Volume:** Key reversal indicator
- **No Demand:** Weakness on rallies
- **Stopping Volume:** Support zone confirmation
## W.D. Gann Theory Analysis
### Time Theory
- **Natural Time Cycles:** 30, 45, 60, 90-day cycles
- **Anniversary Dates:** Previous significant highs/lows
- **Seasonal Tendency:** CHF strength in Q4 historically
### Square of 9
- **Current Level:** 0.80676 sits at 291° on the square
- **Key Angles:** 45°, 90°, 180°, 270° projections
- **Price Targets:** 0.8125 (315°), 0.7975 (270°)
### Angle Theory
- **1x1 Angle:** Primary trend line support/resistance
- **2x1 & 1x2 Angles:** Acceleration/deceleration zones
- **Fan Lines:** Multiple support/resistance confluence
### Price and Time Squaring
- **Price Squares:** 0.8100 (major square), 0.7900 (support square)
- **Time Squares:** 144 hours, 233 hours for next major moves
- **Geometric Relationships:** 50% retracement levels critical
## Ichimoku Kinko Hyo Analysis
### Cloud Analysis
- **Kumo Position:** Price above/below cloud significance
- **Cloud Twist:** Future support/resistance at 0.8090
- **Cloud Thickness:** Strength of support/resistance
### Line Analysis
- **Tenkan-sen:** Short-term momentum (9-period)
- **Kijun-sen:** Medium-term trend (26-period)
- **Chikou Span:** Confirmation signal positioning
## Technical Indicators
### RSI Analysis
- **Overbought:** >70 on 4H+ timeframes
- **Oversold:** <30 indicating reversal potential
- **Divergence:** Hidden/regular divergence patterns
### Bollinger Bands
- **Band Width:** Volatility expansion/contraction
- **Band Squeeze:** Breakout preparation
- **Price Action:** Outside band reversions
### VWAP
- **Daily VWAP:** 0.8055 as key pivot
- **Weekly VWAP:** 0.8020 major support
- **Volume Profile:** High volume nodes at 0.8040, 0.8100
### Moving Averages
- **SMA 20/50/200:** Trend direction confirmation
- **EMA 8/21:** Short-term momentum
- **WMA:** Weighted recent price action emphasis
## Multi-Timeframe Analysis
### Intraday (5M-1H)
- **5M:** Scalping range 0.8055-0.8085
- **15M:** Micro-trend changes, 15-pip ranges
- **30M:** Key breakout timeframe
- **1H:** Primary intraday trend confirmation
### Swing (4H-Monthly)
- **4H:** Major trend shifts, 100-150 pip moves
- **Daily:** Primary trend direction
- **Weekly:** Long-term support/resistance
- **Monthly:** Major trend cycle analysis
## Key Levels & Targets
### Support Levels
1. **0.8050** - Immediate support
2. **0.8020** - Weekly VWAP support
3. **0.7980** - Major support zone
4. **0.7950** - Monthly support
### Resistance Levels
1. **0.8085** - Immediate resistance
2. **0.8100** - Psychological resistance
3. **0.8150** - Major resistance zone
4. **0.8200** - Monthly resistance
## Trading Scenarios
### Bullish Scenario (Probability: 45%)
- **Entry:** Above 0.8090
- **Target 1:** 0.8150
- **Target 2:** 0.8220
- **Stop Loss:** Below 0.8040
### Bearish Scenario (Probability: 40%)
- **Entry:** Below 0.8050
- **Target 1:** 0.7980
- **Target 2:** 0.7920
- **Stop Loss:** Above 0.8100
### Neutral/Range Scenario (Probability: 15%)
- **Range:** 0.8040-0.8120
- **Strategy:** Buy support, sell resistance
- **Breakout:** Wait for clear direction
## Risk Management
- **Position Size:** 1-2% risk per trade
- **Volatility:** Adjust for CHF news events
- **Correlation:** Monitor EUR/USD, GBP/CHF impact
- **Time Decay:** Close positions before major news
## Forecast Summary
The USDCHF pair shows mixed signals with slight bearish bias in the short term due to technical confluence around resistance zones. Key levels to watch are the 0.8050 support and 0.8100 resistance. A break of either level should provide clear directional bias for the next major move.
For those interested in further developing their trading skills based on these types of analyses, consider exploring the mentoring program offered by Shunya dot Trade.(world wide web shunya dot trade)
I welcome your feedback on this analysis, as it will inform and enhance my future work.
Regards,
Shunya.Trade
world wide web shunya dot trade
⚠️ Disclaimer: This post is educational content and does not constitute investment advice, financial advice, or trading recommendations. The views expressed here are based on technical analysis and are shared solely for informational purposes. The stock market is subject to risks, including capital loss, and readers should exercise due diligence before investing. We do not take responsibility for decisions made based on this content. Consult a certified financial advisor for personalized guidance.
I am nothing
Disclaimer
The information and publications are not meant to be, and do not constitute, financial, investment, trading, or other types of advice or recommendations supplied or endorsed by TradingView. Read more in the Terms of Use.
I am nothing
Disclaimer
The information and publications are not meant to be, and do not constitute, financial, investment, trading, or other types of advice or recommendations supplied or endorsed by TradingView. Read more in the Terms of Use.