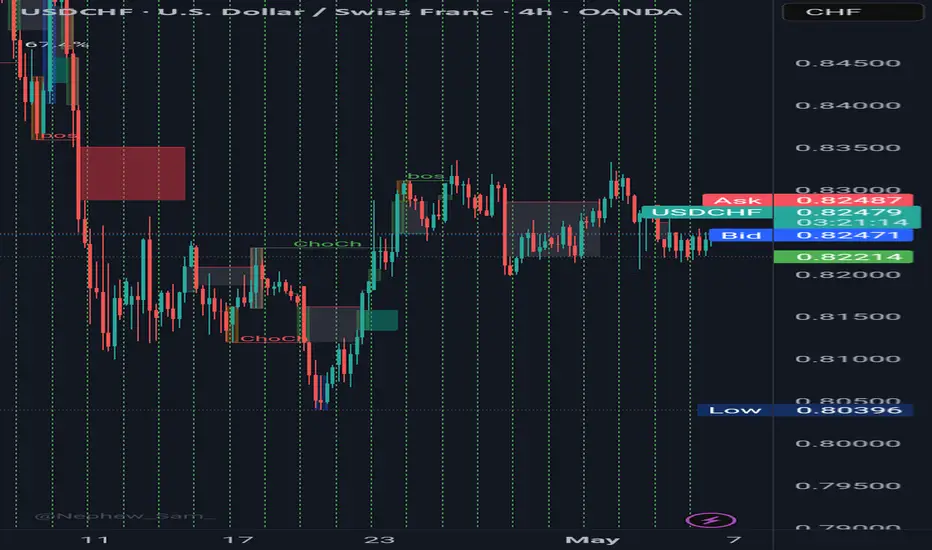
import pandas as pd
import matplotlib.pyplot as plt
# Load your data (CSV must have 'Datetime', 'Open', 'High', 'Low', 'Close')
df = pd.read_csv('EURUSD_15min.csv', parse_dates=['Datetime'])
df.set_index('Datetime', inplace=True)
# Define the ORB time window (e.g., 9:00 to 9:15)
orb_start = '09:00:00'
orb_end = '09:15:00'
# Extract opening range
orb_range = df.between_time(orb_start, orb_end)
orb_high = orb_range['High'].max()
orb_low = orb_range['Low'].min()
# Identify breakout
df['Long_Entry'] = df['High'] > orb_high
df['Short_Entry'] = df['Low'] < orb_low
# Plot breakout levels and entries
plt.figure(figsize=(14,6))
plt.plot(df['Close'], label='Close Price', alpha=0.7)
plt.axhline(orb_high, color='green', linestyle='--', label='ORB High')
plt.axhline(orb_low, color='red', linestyle='--', label='ORB Low')
# Mark breakout points
plt.plot(df[df['Long_Entry']].index, df[df['Long_Entry']]['Close'], '^', color='green', label='Long Entry')
plt.plot(df[df['Short_Entry']].index, df[df['Short_Entry']]['Close'], 'v', color='red', label='Short Entry')
plt.title('EUR/USD ORB Strategy (15-Min)')
plt.legend()
plt.grid()
plt.show()
Disclaimer
The information and publications are not meant to be, and do not constitute, financial, investment, trading, or other types of advice or recommendations supplied or endorsed by TradingView. Read more in the Terms of Use.
Disclaimer
The information and publications are not meant to be, and do not constitute, financial, investment, trading, or other types of advice or recommendations supplied or endorsed by TradingView. Read more in the Terms of Use.
