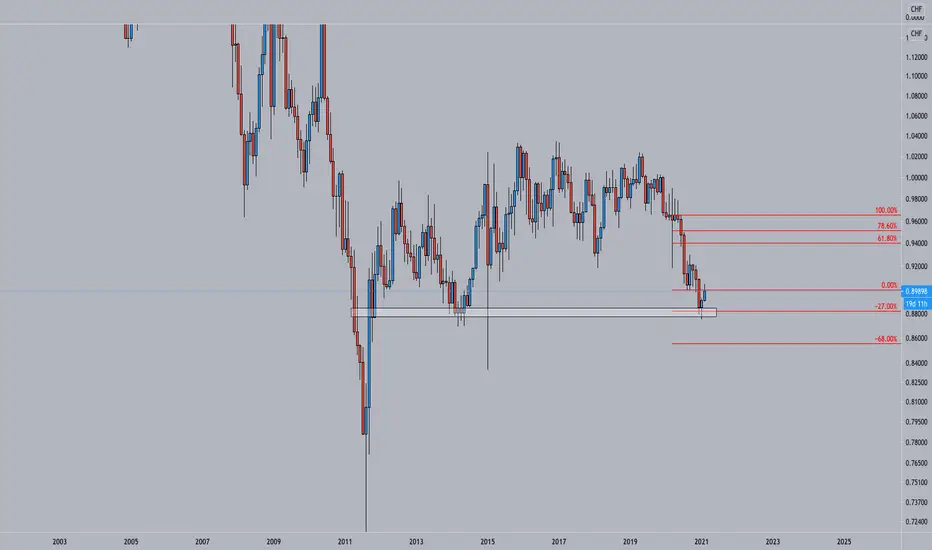
USDCHF was sitting at a very clear Supply & Demand zone, acting as support since September 2011 on the Monthly chart.
This was our first indication for a possible Long set-up.
Another indication is the -27 Monthly Fib completion, which means price can reverse heavily as banks/institutes take profit at these levels.
It seems like it did reverse so let's take a look on the lower time frames to see what's going on.
Of course we want some DXY strength for a long position on USDCHF.
Note
On the Weekly chart we are making LLs and LHs.Around the white box, you can see price is really struggling to go down for multiple weeks.
Also on the Weekly chart we have a clear Fib completion.
These are all indications for a possible Long set-up.
Note
On the Daily chart, we were making LLs and LHs. At one point, we have received a clear Reversal Pattern in the form of an Inverse Head & Shoulders.
We broke the downtrend/last LH and are in an uptrend now on the Daily chart.
It seems like it will retest the previous structure (white box) as support and form a 'Bullish M' pattern.
If we approach our zone of interest (78.60 Fib), we will look for an entry on the 4H chart.
Note
On the 4H chart, we want the price to approach our zone of interest correctively or with deceleration before considering a Long set-up.Always remain neutral and anticipate on the situation.
Disclaimer
The information and publications are not meant to be, and do not constitute, financial, investment, trading, or other types of advice or recommendations supplied or endorsed by TradingView. Read more in the Terms of Use.
Disclaimer
The information and publications are not meant to be, and do not constitute, financial, investment, trading, or other types of advice or recommendations supplied or endorsed by TradingView. Read more in the Terms of Use.