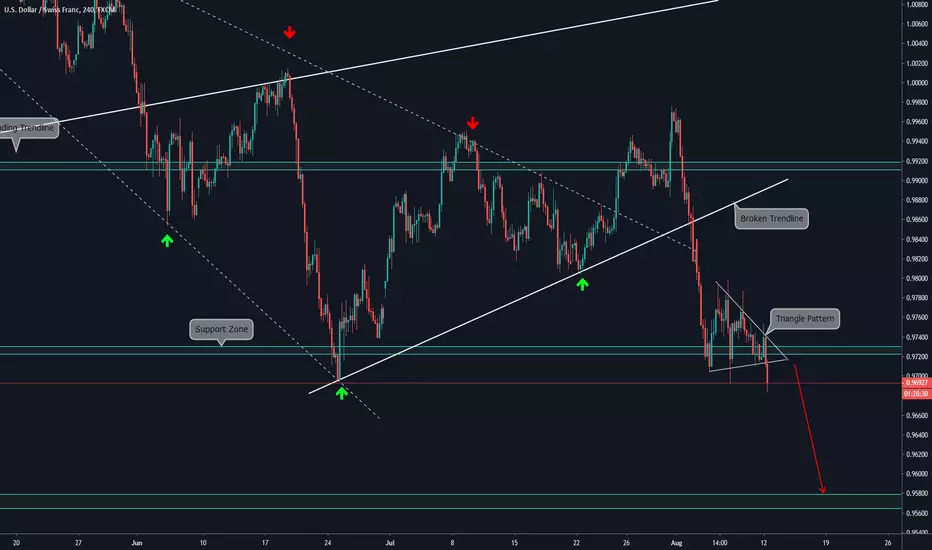
4H CHART EXPLANATION:
On the 4H timeframe, price melted down after facing the Resistance Zone. The last few days it was moving sideways on the Support Zone, forming a Triangle Pattern that is trying to resolve on the actual candlestick. If it consolidates below, price has potential to reach the Support Zone at 0.95600-0.95800.
MULTI TIMEFRAME ANALYSIS:
-Daily:

-Weekly:

On the 4H timeframe, price melted down after facing the Resistance Zone. The last few days it was moving sideways on the Support Zone, forming a Triangle Pattern that is trying to resolve on the actual candlestick. If it consolidates below, price has potential to reach the Support Zone at 0.95600-0.95800.
MULTI TIMEFRAME ANALYSIS:
-Daily:
-Weekly:
Disclaimer
The information and publications are not meant to be, and do not constitute, financial, investment, trading, or other types of advice or recommendations supplied or endorsed by TradingView. Read more in the Terms of Use.
Disclaimer
The information and publications are not meant to be, and do not constitute, financial, investment, trading, or other types of advice or recommendations supplied or endorsed by TradingView. Read more in the Terms of Use.