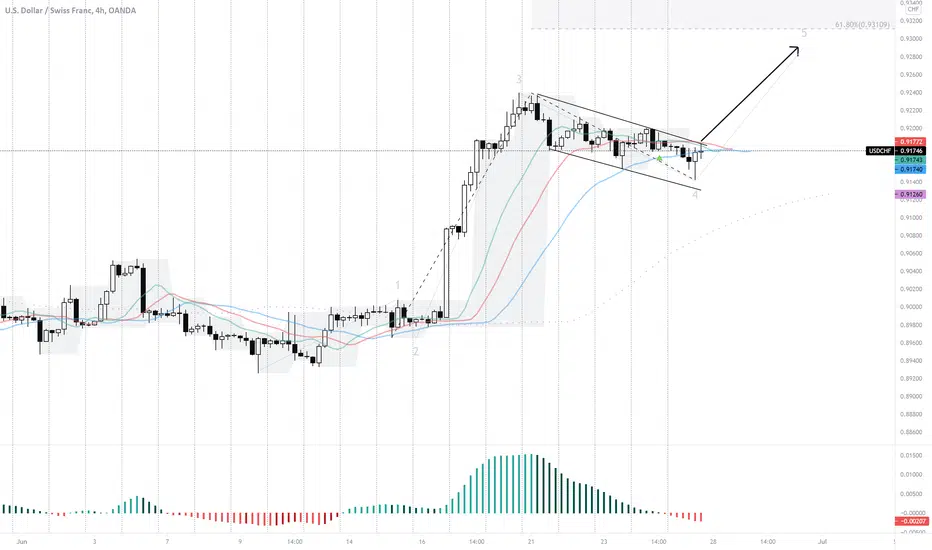
I have marked the chart with potential Elliott wave on the 4 hour chart.
We see a strong wave 3 up followed by what can be seen as a bullish flag on the D1 chart and some sort of a bear wedge on the 4 hour chart
From what I Call THE SETUP ONE concept it is a wave 4 within tight boxes. I see a 4 hour bullish candle. I am long above this
Long Entry: 0.9175
Stop Loss: 0.9135
Target 1: (Peak of Wave 3) @ 0.9233
Target 2 : This is the Target Zone 1 are 0.9295
Good luck!
To get our premium tools visit: itradeaims.net
Disclaimer
The information and publications are not meant to be, and do not constitute, financial, investment, trading, or other types of advice or recommendations supplied or endorsed by TradingView. Read more in the Terms of Use.
To get our premium tools visit: itradeaims.net
Disclaimer
The information and publications are not meant to be, and do not constitute, financial, investment, trading, or other types of advice or recommendations supplied or endorsed by TradingView. Read more in the Terms of Use.