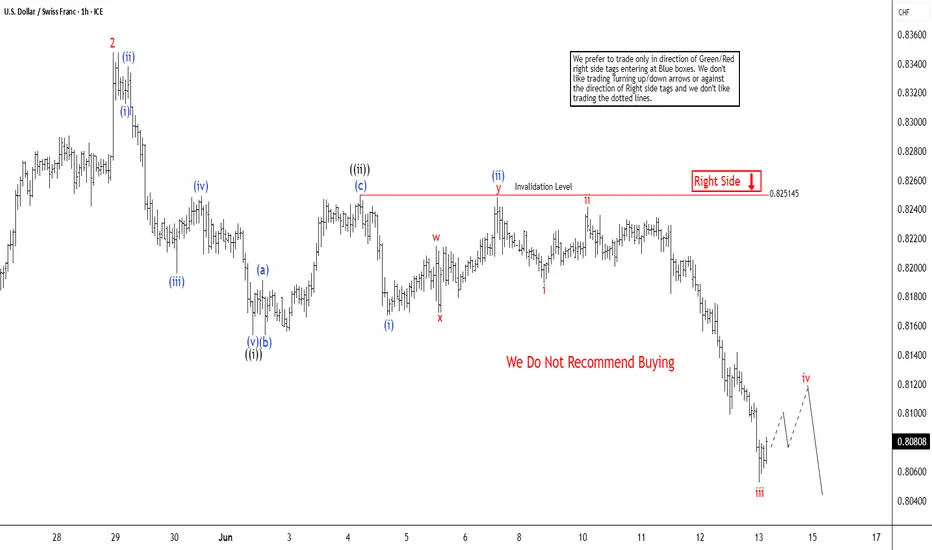
The USDCHF currency pair has been declining since its peak on May 13, 2025. It follows a pattern that technical analysts identify as an impulsive wave with an extended structure, often referred to as a “nest.” This analysis tracks the pair’s movement through a series of waves, as observed on the 1-hour chart. It provides insight into its short-term trajectory and potential future movements.
Starting from the May 13 high, the initial decline, labeled wave 1, concluded at 0.8184. This was followed by a corrective rally in wave 2, which peaked at 0.8347. From there, the pair resumed its downward trend in wave 3. The wave 3 has unfolded with further subdivisions, forming another impulsive pattern in a lesser degree. Specifically, from the wave 2 high, the first sub-wave (i) ended at 0.8312, followed by a brief rally in wave (ii) to 0.8338. The pair then extended lower in wave (iii), reaching 0.8195, before a corrective wave (iv) rallied to 0.8249. The subsequent decline in wave (v) completed at 0.8153, finalizing wave ((i)) of the larger structure.
Following this, a recovery rally in wave ((ii)) reached 0.8250 before the pair turned lower again in wave ((iii)). Within this segment, the first sub-wave (i) ended at 0.8167, and a corrective wave (ii) rallied to 0.8248. In the near term, as long as the pair remains below 0.8250, any rallies are expected to fail after 3, 7, or 11 swings, with the pair likely to extend lower. This analysis suggests continued bearish momentum, with traders advised to monitor key levels for confirmation of further downside.
14 days trial --> elliottwave-forecast.com/plan-trial/ and get Accurate & timely Elliott Wave Forecasts of 78 instruments. Webinars, Chat Room, Stocks/Forex/Indices Signals & more.
Disclaimer
The information and publications are not meant to be, and do not constitute, financial, investment, trading, or other types of advice or recommendations supplied or endorsed by TradingView. Read more in the Terms of Use.