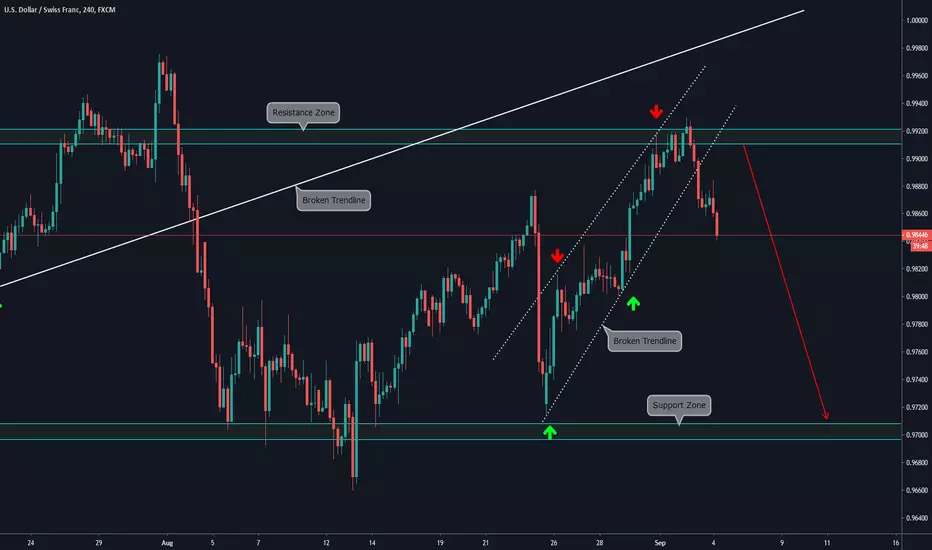
4H CHART EXPLANATION:
As we explain on the Daily Chart, price has bounced at the top of the Range. On the 4H chart can be observed that the Ascending Trendline of the Bullish movement has been broken, and price is moving downwards strongly. We are waiting for a correction here to consider entering the market.
DAILY CHART:
Disclaimer
The information and publications are not meant to be, and do not constitute, financial, investment, trading, or other types of advice or recommendations supplied or endorsed by TradingView. Read more in the Terms of Use.
Disclaimer
The information and publications are not meant to be, and do not constitute, financial, investment, trading, or other types of advice or recommendations supplied or endorsed by TradingView. Read more in the Terms of Use.