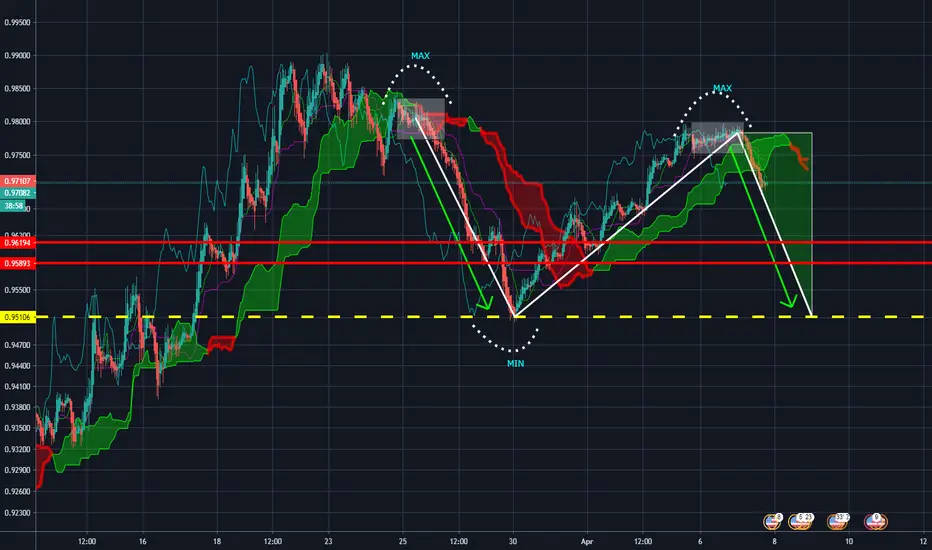
As you can see in the chart, the chart reached its maximum after lateral movement as before.
Previously, before the decline, the chart was climbing up the stairs, as can be seen now.
The chart reached the maximum in two places and hence it must also be a minimum of two times.
Based on the ichimoku indicator we are able to deduce after passing the price through the cloud that it will have a downward direction with possible correction as before.
There was also a wave V that you can consider as a big correction and expect a big drop .
I have marked the likely places of correction in red, but there may be a correction around the yellow line which is the level of earlier decline (correction).
But after introducing the Hosoda projection onto the graph (which is not present in my graph), we probably have to deal with the N or NT wave, which may reach levels with red color.
I think that my analysis is quite in depth so I think it is worth using it.
Thank you for your attention,
ElCharlie
Disclaimer
The information and publications are not meant to be, and do not constitute, financial, investment, trading, or other types of advice or recommendations supplied or endorsed by TradingView. Read more in the Terms of Use.
Disclaimer
The information and publications are not meant to be, and do not constitute, financial, investment, trading, or other types of advice or recommendations supplied or endorsed by TradingView. Read more in the Terms of Use.