Hi Traders!
The market is in an overall Downtrend.
Let's start our Mulitple Timeframe Analyis as always with the weekly Timeframe.
Here is the weekly Timeframe W1:

As you can see the market was ranging for a long time.
But after some time, it approached the Weekly Support.
After one failed attempt, it tried a second time and succeed.
The price even made a successful Retest.
Since then it is moving in a falling Wedge.
The next target is the Weeky Support at 0.87000.
Let's move on to the Daily Timeframe:

Here we can analyse the situation after the weekly Break more accurate.
The market was moving - after the successful Retrst of the Level of Break (tourquise Level) -
in a descending Triangle:
It made lower Highs into Support.
Finally, it broke out, but without any Retest.
The market fell from 0.90 to about 0.88.
If you consider the Price action closely, you'll surely see that the candles are getting smaller and smaller.
So, now one question for you:
You see a car racing up and moving fast towards a curve.
Suddenly, it slows down.
Do you think, it is going to break the curve?
Of course not!
It is most likely to reverse from there.
(Obviously it cannot "break" the curve, but you get the point, right?)
So, we should look out for a potential Trend Change on the lower Timeframes.
The target for a potential Trend Change is the "Level of Breakout of the descending Triangle2.
That's because two other things confluences with that:
- The Upper Trendline of the weekly Wedge and
- the 50 EMA
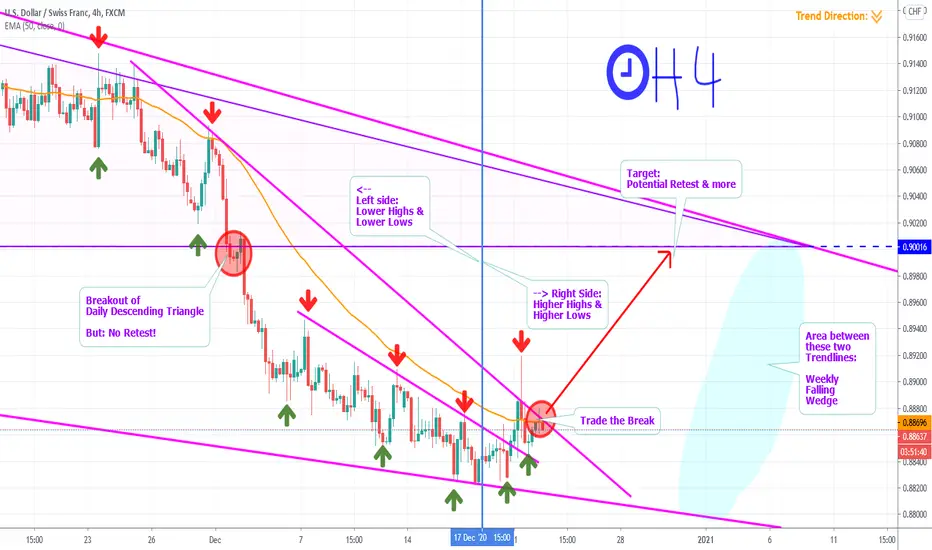
Let's continue with the H4-Timeframe:

What do we do to detect a Trend?
As a beginner we mark up the Lows and Highs and see whether they go up or down.
We used the same method here.
As you can see the market made lower Lows and lower Highs.
But at one certain point, we recognized a change.
Since then it started to made higher Highs and higher Lows.
That's one way to detect a Trend Change.
The Trading Plan is to trade the Breakout of the descending Trendline.
We already set up the Target on the daily TF.
Let's set up the SL on the hourly TF.
Here is the H1-Timeframe:

In addition to the Trendline Break on the H4-TF we here have a symmetrical Triangle Pattern.
We can set our SL below the recent low and the Entry above the recent high.
We can also see, that the Bears tried two times to push the price down lower, but they failed.
That could mean, that we have hidden Bullish Strenght in the market.
We recommend to trade carefully, because this is a counter Trend Trade.
Thanks and successful Trading :)!
The market is in an overall Downtrend.
Let's start our Mulitple Timeframe Analyis as always with the weekly Timeframe.
Here is the weekly Timeframe W1:
As you can see the market was ranging for a long time.
But after some time, it approached the Weekly Support.
After one failed attempt, it tried a second time and succeed.
The price even made a successful Retest.
Since then it is moving in a falling Wedge.
The next target is the Weeky Support at 0.87000.
Let's move on to the Daily Timeframe:
Here we can analyse the situation after the weekly Break more accurate.
The market was moving - after the successful Retrst of the Level of Break (tourquise Level) -
in a descending Triangle:
It made lower Highs into Support.
Finally, it broke out, but without any Retest.
The market fell from 0.90 to about 0.88.
If you consider the Price action closely, you'll surely see that the candles are getting smaller and smaller.
So, now one question for you:
You see a car racing up and moving fast towards a curve.
Suddenly, it slows down.
Do you think, it is going to break the curve?
Of course not!
It is most likely to reverse from there.
(Obviously it cannot "break" the curve, but you get the point, right?)
So, we should look out for a potential Trend Change on the lower Timeframes.
The target for a potential Trend Change is the "Level of Breakout of the descending Triangle2.
That's because two other things confluences with that:
- The Upper Trendline of the weekly Wedge and
- the 50 EMA
Let's continue with the H4-Timeframe:
What do we do to detect a Trend?
As a beginner we mark up the Lows and Highs and see whether they go up or down.
We used the same method here.
As you can see the market made lower Lows and lower Highs.
But at one certain point, we recognized a change.
Since then it started to made higher Highs and higher Lows.
That's one way to detect a Trend Change.
The Trading Plan is to trade the Breakout of the descending Trendline.
We already set up the Target on the daily TF.
Let's set up the SL on the hourly TF.
Here is the H1-Timeframe:
In addition to the Trendline Break on the H4-TF we here have a symmetrical Triangle Pattern.
We can set our SL below the recent low and the Entry above the recent high.
We can also see, that the Bears tried two times to push the price down lower, but they failed.
That could mean, that we have hidden Bullish Strenght in the market.
We recommend to trade carefully, because this is a counter Trend Trade.
Thanks and successful Trading :)!
Disclaimer
The information and publications are not meant to be, and do not constitute, financial, investment, trading, or other types of advice or recommendations supplied or endorsed by TradingView. Read more in the Terms of Use.
Disclaimer
The information and publications are not meant to be, and do not constitute, financial, investment, trading, or other types of advice or recommendations supplied or endorsed by TradingView. Read more in the Terms of Use.