Over the last three trading sessions, USD/CHF has declined more than 1.5%, as a consistent bearish bias persists, pushing the pair back to multi-month lows. Selling pressure has remained firm amid uncertainty surrounding the escalation of political and military tensions in the Middle East. So far, the U.S. dollar has failed to act as a safe haven, while the Swiss franc has maintained its strength, reinforcing the current bearish trend. If this downward momentum continues, the selling trend could become even more dominant.
Consistent Bearish Trend
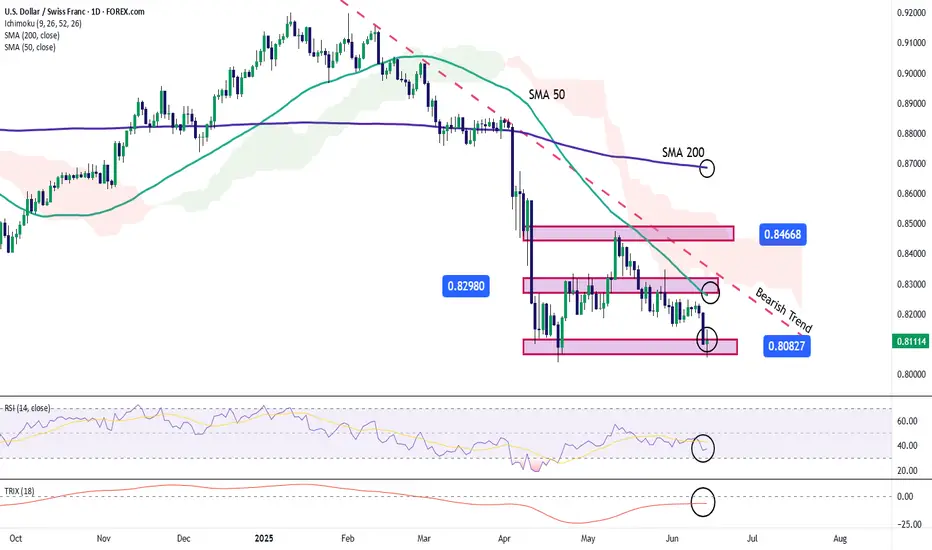
Since the beginning of the year, USD/CHF has shown consistent selling swings, leading to the formation of a strong downtrend in recent weeks. Currently, the selling pressure has been strong enough to drive the pair back to recent lows, and if the bearish momentum continues below this level, the downward trend may gain further relevance. In the absence of any significant bullish corrections, the bearish trend remains the dominant pattern in the short term.
RSI
The RSI line continues to move below the 50 level, indicating that selling impulses remain dominant in recent sessions. As long as RSI remains below the neutral zone, the bearish momentum is likely to persist.
TRIX
The TRIX line has been oscillating below the neutral level of 0, suggesting that the average strength of the exponential moving averages still reflects a bearish market bias. This may indicate that the current downtrend still has room to continue in the near term.
However, it is important to note that the price is currently sitting at a key support zone, which could serve as a launch point for potential bullish corrections in the upcoming sessions.
Key Levels to Watch:
Written by Julian Pineda, CFA – Market Analyst
Consistent Bearish Trend
Since the beginning of the year, USD/CHF has shown consistent selling swings, leading to the formation of a strong downtrend in recent weeks. Currently, the selling pressure has been strong enough to drive the pair back to recent lows, and if the bearish momentum continues below this level, the downward trend may gain further relevance. In the absence of any significant bullish corrections, the bearish trend remains the dominant pattern in the short term.
RSI
The RSI line continues to move below the 50 level, indicating that selling impulses remain dominant in recent sessions. As long as RSI remains below the neutral zone, the bearish momentum is likely to persist.
TRIX
The TRIX line has been oscillating below the neutral level of 0, suggesting that the average strength of the exponential moving averages still reflects a bearish market bias. This may indicate that the current downtrend still has room to continue in the near term.
However, it is important to note that the price is currently sitting at a key support zone, which could serve as a launch point for potential bullish corrections in the upcoming sessions.
Key Levels to Watch:
- 0.84668 – Major Resistance: This level marks the recent high reached in past months. If buying momentum pushes the pair back up to this level, it may pose a threat to the current downtrend and trigger a more relevant bullish move.
- 0.82980 – Short-Term Barrier: This level aligns with the 50-period moving average. Bullish moves above this point could challenge the current bearish formation and introduce a neutral short-term bias.
- 0.80827 – Key Support: This level aligns with the chart’s recent lows. While it may trigger upside corrections, a break below it could reactivate significant selling pressure in upcoming sessions.
Written by Julian Pineda, CFA – Market Analyst
Disclaimer
The information and publications are not meant to be, and do not constitute, financial, investment, trading, or other types of advice or recommendations supplied or endorsed by TradingView. Read more in the Terms of Use.
Disclaimer
The information and publications are not meant to be, and do not constitute, financial, investment, trading, or other types of advice or recommendations supplied or endorsed by TradingView. Read more in the Terms of Use.