1. Market Context & Structure
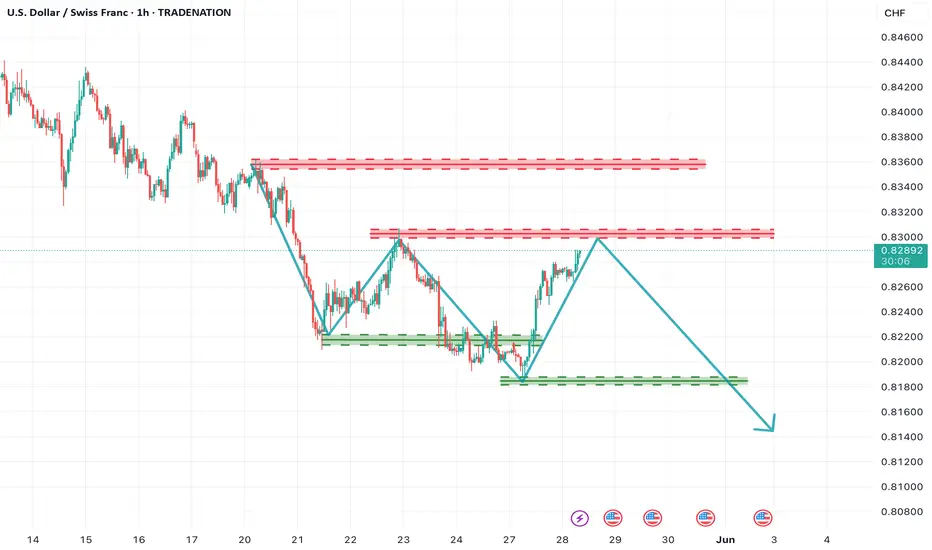
The USD/CHF currency pair is currently exhibiting a bearish market structure on the 1-hour chart. After a sharp decline from the 0.8360+ level, the price has attempted to recover but remains in a corrective phase. This recovery appears to be forming lower highs and is approaching a key resistance zone. The overall structure shows a series of sharp drops followed by weaker upward retracements, a classic sign of sellers still being in control. The current rise toward the 0.8300–0.8310 level is likely a corrective move, not a reversal, and could act as an ideal zone for a fresh bearish entry.
2. Key Technical Zones
Three key price zones define this setup. The first is the resistance zone between 0.8300 and 0.8310, marked with a red box. This area has previously acted as a strong supply zone where price faced heavy selling pressure, and it is likely to be respected again. The second important area is the intermediate support between 0.8210 and 0.8225, which could serve as a partial target for profit booking or re-entry on bounce. Finally, the major demand zone lies around 0.8160 to 0.8175, a level where price previously paused before resuming upward correction. These zones collectively provide logical stop loss and target levels for managing the trade with discipline.
3. Trading Plan (Sell Setup)
The trade idea here is to initiate a short position as the price enters the 0.8300–0.8310 resistance zone. This level aligns with the previous high and the edge of a well-defined supply area. A stop loss should be placed slightly above the resistance zone—around 0.8330—to avoid getting stopped out by minor spikes or false breakouts. For targets, the first take-profit can be at 0.8225, near the intermediate support zone. If bearish momentum continues, the next logical target is at 0.8175, which aligns with previous price rejections. This plan offers a clean setup with a favorable risk-to-reward ratio of at least 1:2 or higher, depending on the exact entry and target levels.
4. Confluences Supporting the Trade
Several technical factors strengthen the case for a short position at the identified level. First, the price is moving within a downtrend, confirmed by the lower highs and lower lows. The approach toward the resistance zone appears to be a corrective wave, not a breakout. Second, the chart shows a potential M-pattern formation, where the second peak aligns closely with the previous one, indicating a likely double-top scenario. Moreover, price previously reversed sharply from this resistance zone, and similar rejection candles could appear again. This confluence of trend, price action patterns, and zone-based analysis strongly supports the bearish outlook.
5. Expected Move
Based on the current structure, once price reaches the resistance at 0.8300–0.8310, a rejection is expected. This could lead to a pullback first to the 0.8225 support area. If this level is broken with momentum, a continued decline toward the 0.8175–0.8160 zone is highly probable. This move aligns with the overall bearish trend and would complete the projected wave structure shown in the chart. Traders should watch for signs of reversal (bearish engulfing, rejection wicks) at resistance to confirm entry.
6. Trade Management
Proper trade management is key to success with this setup. Once the position is live, it's recommended to book partial profits around the 0.8225 level to secure gains. The stop loss can then be moved to breakeven or entry price to make the trade risk-free. If price bounces from this level, re-entry opportunities can be evaluated with tighter stop-losses. If the move continues beyond 0.8225, the position should be held toward the 0.8175 target with trailing stop-loss adjustments. Also, traders should be cautious around high-impact USD or CHF news events, which can cause volatility and invalidate technical levels.
===================================================================
Disclosure: I am part of Trade Nation's Influencer program and receive a monthly fee for using their TradingView charts in my analysis.
📈 Trade Smarter with TradZoo!
🔗 Website: bit.ly/tradzoopage
📣 Telegram: t.me/tradzooIndex
📲 Android App: bit.ly/TradZooApp
📲 Forex App:tradzoo.com/forex/download
🍎 iOS App: bit.ly/TradZoo-iOS-App
🔗 Website: bit.ly/tradzoopage
📣 Telegram: t.me/tradzooIndex
📲 Android App: bit.ly/TradZooApp
📲 Forex App:tradzoo.com/forex/download
🍎 iOS App: bit.ly/TradZoo-iOS-App
Related publications
Disclaimer
The information and publications are not meant to be, and do not constitute, financial, investment, trading, or other types of advice or recommendations supplied or endorsed by TradingView. Read more in the Terms of Use.