Hi Traders!
The market is in a Downtrend.
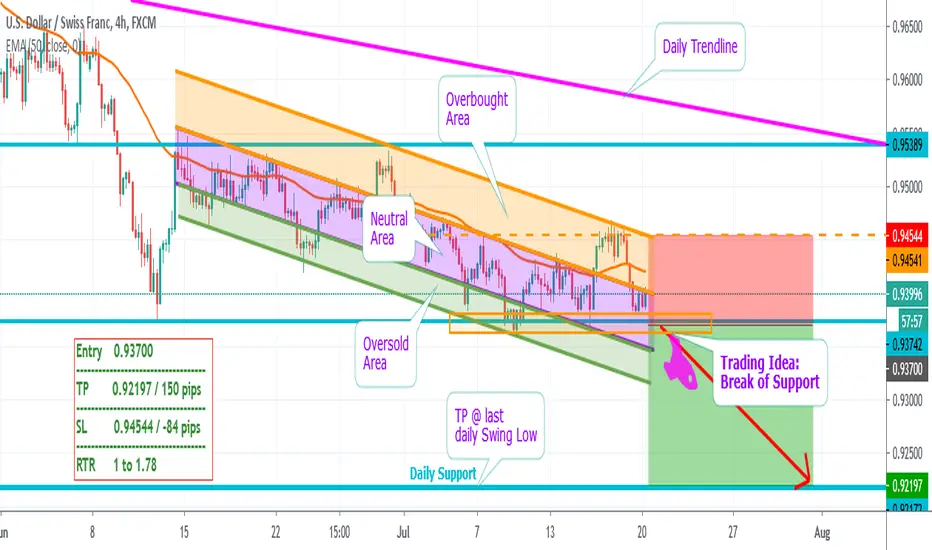
As you can see we here drawed three Parallel Channels.
Let's go into it:
The Parallel Channel with the most touches is the (purple) one in the middle.
This is our "main" Channel, which is respected by many Traders.
It is the most valuable.
However, we also have to other Parallel Channels.
Outside the "neutral Area" we had some False Breakouts.
The market broke out, but came in again quickly.
Yes, you can extend the "main" Channel to the highest and lowest Points so it is only one Channel.
It'll be still valid.
But we want to share with you the secrets:
You can here identify "oversold" and "overbought" areas - such as at the RSI-Indicator.
The Upper Channel starts from the Top of the "main" Channel and goes to the highest Points; and vice versa for the Lower Channel.
When the Price reaches the Upper or Lower Channel you can expect a potential Reversal.
Let's come to the idea, which has less to do with Parallel Channels.
Now the Market is at an important Resistance.
Because of the Pressure the market is giving to the Resistance, it won't be able to hold.
The idea is to trade the Breakout towards the daily Resistance.
It is the last Swing Low of the daily Price.
We recommend to trade the Breakout with a Retest.
Thanks and successful Trading :)!
The market is in a Downtrend.
As you can see we here drawed three Parallel Channels.
Let's go into it:
The Parallel Channel with the most touches is the (purple) one in the middle.
This is our "main" Channel, which is respected by many Traders.
It is the most valuable.
However, we also have to other Parallel Channels.
Outside the "neutral Area" we had some False Breakouts.
The market broke out, but came in again quickly.
Yes, you can extend the "main" Channel to the highest and lowest Points so it is only one Channel.
It'll be still valid.
But we want to share with you the secrets:
You can here identify "oversold" and "overbought" areas - such as at the RSI-Indicator.
The Upper Channel starts from the Top of the "main" Channel and goes to the highest Points; and vice versa for the Lower Channel.
When the Price reaches the Upper or Lower Channel you can expect a potential Reversal.
Let's come to the idea, which has less to do with Parallel Channels.
Now the Market is at an important Resistance.
Because of the Pressure the market is giving to the Resistance, it won't be able to hold.
The idea is to trade the Breakout towards the daily Resistance.
It is the last Swing Low of the daily Price.
We recommend to trade the Breakout with a Retest.
Thanks and successful Trading :)!
Note
This is the RED BOX, you might were looking for:Disclaimer
The information and publications are not meant to be, and do not constitute, financial, investment, trading, or other types of advice or recommendations supplied or endorsed by TradingView. Read more in the Terms of Use.
Disclaimer
The information and publications are not meant to be, and do not constitute, financial, investment, trading, or other types of advice or recommendations supplied or endorsed by TradingView. Read more in the Terms of Use.