Sometimes, you do not even need fancy lines, zones, and indicators to put out an amazing chart setup. When you have enough experience and practice, it is really easy to take a quick glimpse at a graph and understand what is going on.
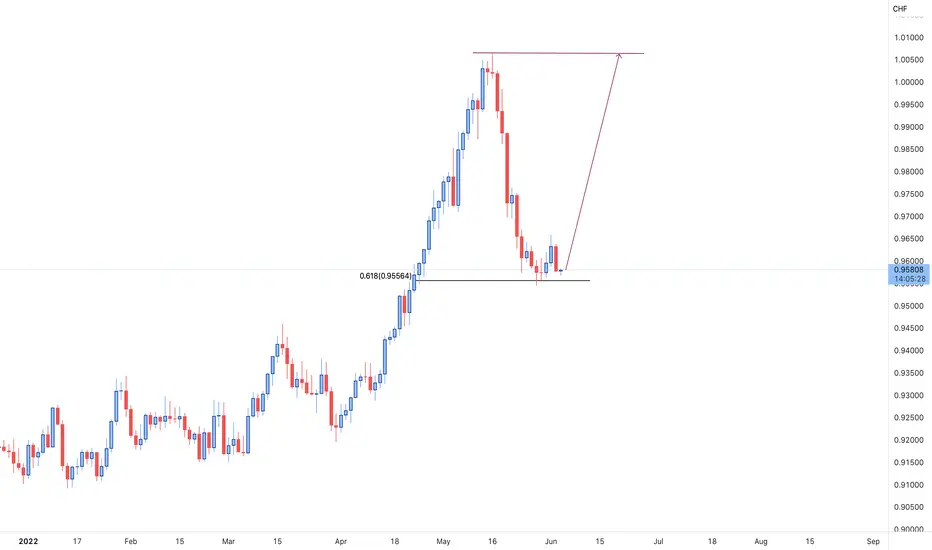
For instance, looking at the DAILY timeframe graph of USD/CHF, it can be inferred that the sentiment of the market is bullish and that the price is forming a double bottom on the 0.618 Fibonacci retracement level. These two confluences are enough for us to zoom into lower timeframes and look for possible BUY entries once enough confirmations are provided.
For instance, looking at the DAILY timeframe graph of USD/CHF, it can be inferred that the sentiment of the market is bullish and that the price is forming a double bottom on the 0.618 Fibonacci retracement level. These two confluences are enough for us to zoom into lower timeframes and look for possible BUY entries once enough confirmations are provided.
Disclaimer
The information and publications are not meant to be, and do not constitute, financial, investment, trading, or other types of advice or recommendations supplied or endorsed by TradingView. Read more in the Terms of Use.
Disclaimer
The information and publications are not meant to be, and do not constitute, financial, investment, trading, or other types of advice or recommendations supplied or endorsed by TradingView. Read more in the Terms of Use.