Hello,
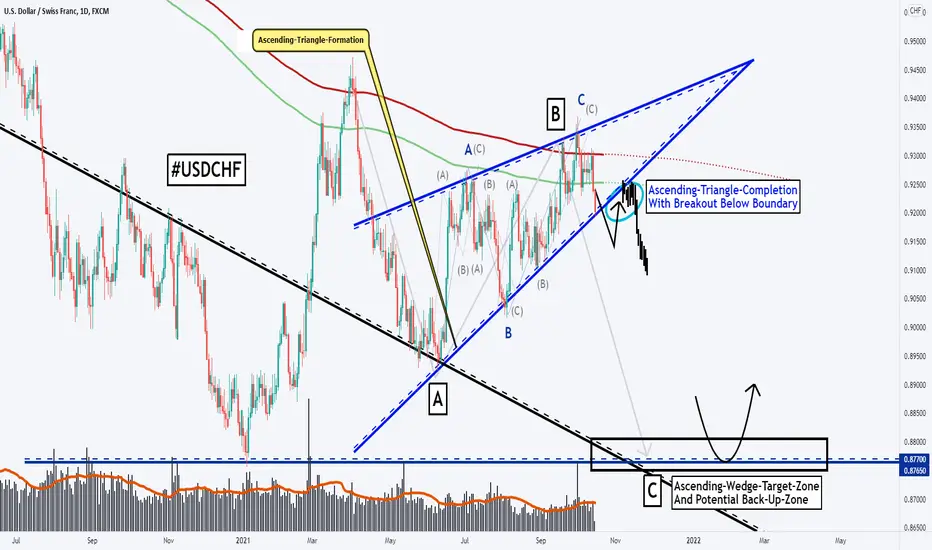
Welcome to this analysis about USDCHF and the daily timeframe perspectives. As when looking at my chart we can watch there how USDCHF is building this main ascending-triangle-formation marked in blue, in this triangle USDCHF has the coherent wave-count reaching from A to C and now recently pulled back off the upper-boundary of the triangle serving as resistance together with the 500-EMA in red and the 400-EMA in green. It is likely that this pullback moves on in the near future and when USDCHF then marks below the lower boundary of the triangle this will complete the whole triangle bearishly and will be the origin for further bearish continuations as well as activation of the lower target-zone in the 0.8765 Usd level marked in blue. When USDCHF reaches out this level the situations needs to be elevated anew and how USDCHF reacts into it. For now we should expect the completion of the ascending-triangle to happen, it will be an important development.
In this manner, thank you for watching the analysis, it will be great when you support it with a like, follow and comment for more upcoming market analysis, all the best!
"Trading effectively is about assessing possibilities, not certainties."
Information provided is only educational and should not be used to take action in the markets.
►✅JOIN THE BEST+ TOP TELEGRAM TRADING CHANNEL: t.me/VincePrinceForexGoldStocks
►🚀Write To Join the Elite VIP Signal Channels: @Vince_Prince
►🔥JOIN BYBIT TOP EXCHANGE►🎁 UP TO $30,000 BONUS NOW: partner.bybit.com/b/VinceByBit
►🚀Write To Join the Elite VIP Signal Channels: @Vince_Prince
►🔥JOIN BYBIT TOP EXCHANGE►🎁 UP TO $30,000 BONUS NOW: partner.bybit.com/b/VinceByBit
Disclaimer
The information and publications are not meant to be, and do not constitute, financial, investment, trading, or other types of advice or recommendations supplied or endorsed by TradingView. Read more in the Terms of Use.