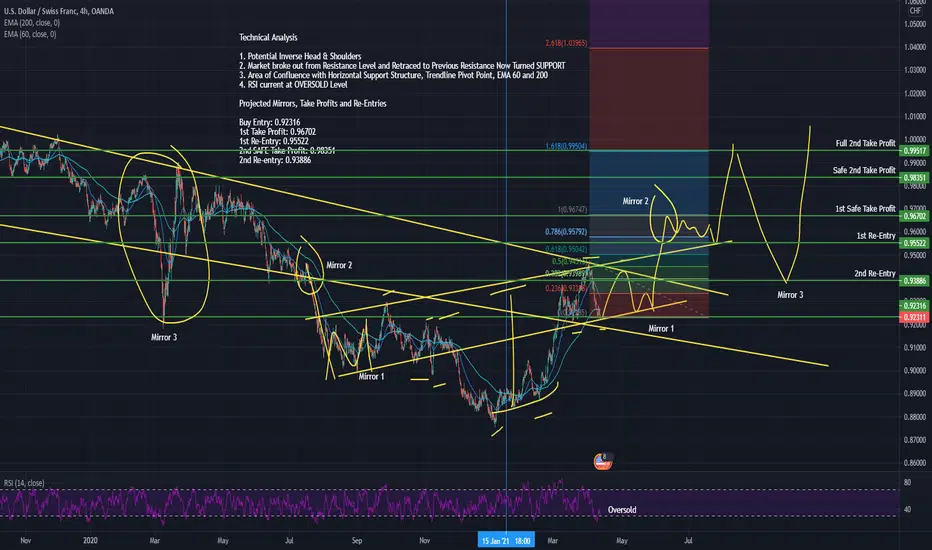
Technical Analysis
1. Potential Inverse Head & Shoulders
2. Market broke out from Resistance Level and Retraced to Previous Resistance Now Turned SUPPORT
3. Area of Confluence with Horizontal Support Structure, Trendline Pivot Point, EMA 60 and 200
4. RSI current at OVERSOLD Level
Projected Mirrors, Take Profits and Re-Entries
Buy Entry: 0.92316
1st Take Profit: 0.96702
1st Re-Entry: 0.95522
2nd SAFE Take Profit: 0.98351
2nd Re-entry: 0.93886
Trade active
Disclaimer
The information and publications are not meant to be, and do not constitute, financial, investment, trading, or other types of advice or recommendations supplied or endorsed by TradingView. Read more in the Terms of Use.
Disclaimer
The information and publications are not meant to be, and do not constitute, financial, investment, trading, or other types of advice or recommendations supplied or endorsed by TradingView. Read more in the Terms of Use.