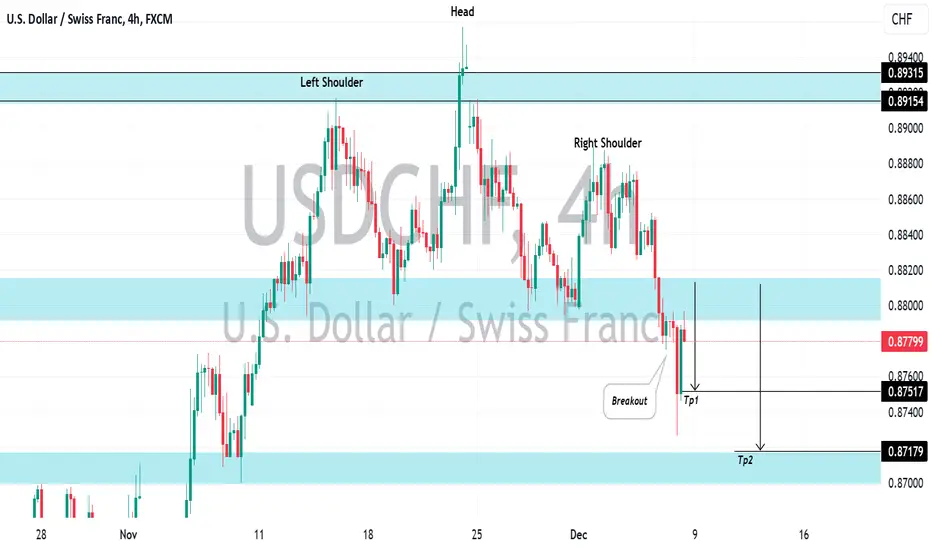
The 📉USDCHF formed a huge head and shoulders pattern on the 4-hour chart. Following the release of US economic data on Friday, the price declined sharply, breaking through the pattern's neckline.
Later that night, the price effectively retested the broken neckline and confirmed resistance at that level.
We can now expect a continuation of the bearish trend.
Next support levels are 0.8751 and 0.8720.
Later that night, the price effectively retested the broken neckline and confirmed resistance at that level.
We can now expect a continuation of the bearish trend.
Next support levels are 0.8751 and 0.8720.
Join our Telegram channel for daily market update 👇👇
t.me/TheAceTrading
For paid signal👇👇 t.me/linofx1999
t.me/TheAceTrading
For paid signal👇👇 t.me/linofx1999
Related publications
Disclaimer
The information and publications are not meant to be, and do not constitute, financial, investment, trading, or other types of advice or recommendations supplied or endorsed by TradingView. Read more in the Terms of Use.