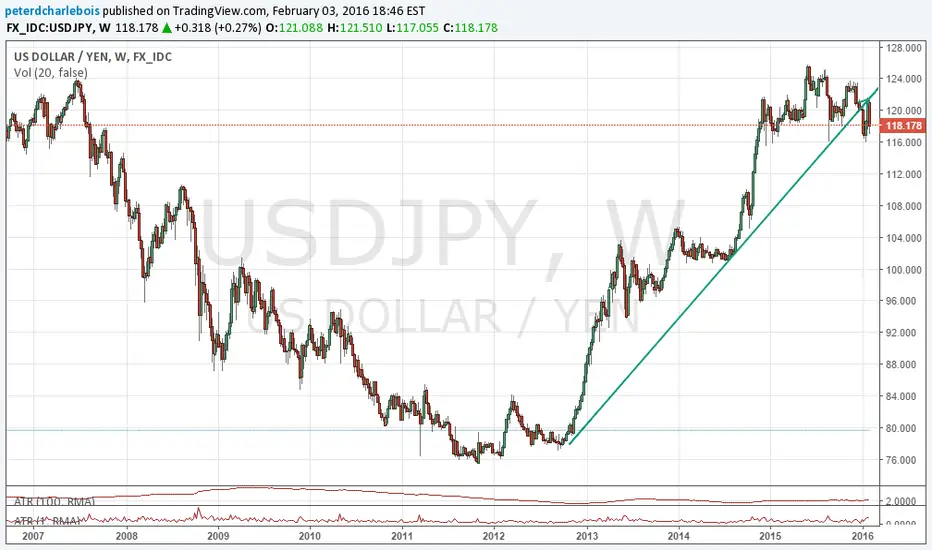
Look at this chart of the USDJPY with weekly candles. It would make sense to at least surmise that there is a temporary top in place. Should we be looking to go long? or short? Below 116.00 should confirm the top for now. The price action from Feb 2nd is twice the average daily range. There are many possible Elliott Wave counts on this. 3 in particular that all seem to fit. 1 suggest a top, 1 suggest a shorter term pull back and renewed upside and another still, suggests a very long term top. With the daily range being so high and rejection of 121.75 to the downside... what do you expect?
Note
it's time to start thinking now that a bottom could be in placeNote
It's time to start looking up on this pair now. This week's candle looks like a key reversalRelated publications
Disclaimer
The information and publications are not meant to be, and do not constitute, financial, investment, trading, or other types of advice or recommendations supplied or endorsed by TradingView. Read more in the Terms of Use.
Related publications
Disclaimer
The information and publications are not meant to be, and do not constitute, financial, investment, trading, or other types of advice or recommendations supplied or endorsed by TradingView. Read more in the Terms of Use.