USDJPY 1-hour chart short analysis
Pattern Formation
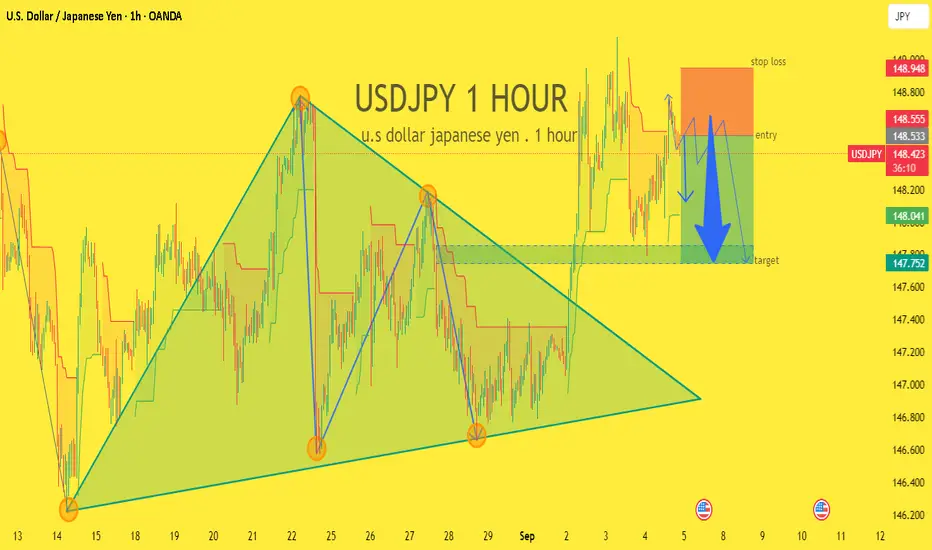
The chart shows a triangle breakout structure.
Price broke upward from the consolidation but quickly faced resistance near 148.800 – 148.950 zone.
Current Setup
Entry area: around 148.500.
Stop loss: above 148.950 (strong resistance zone).
Target: near 147.750, aligning with previous support and the projected measured move.
Bearish Bias
The drawn blue arrow suggests a short trade idea.
The logic: After a false breakout/rejection at resistance, price may retest the lower support Confirmation Signals
Bearish candlestick patterns near 148.5–148.6 (like engulfing or rejection wicks).
Break below 148.200 to confirm bearish momentum.
Volume increase on the downside
Pattern Formation
The chart shows a triangle breakout structure.
Price broke upward from the consolidation but quickly faced resistance near 148.800 – 148.950 zone.
Current Setup
Entry area: around 148.500.
Stop loss: above 148.950 (strong resistance zone).
Target: near 147.750, aligning with previous support and the projected measured move.
Bearish Bias
The drawn blue arrow suggests a short trade idea.
The logic: After a false breakout/rejection at resistance, price may retest the lower support Confirmation Signals
Bearish candlestick patterns near 148.5–148.6 (like engulfing or rejection wicks).
Break below 148.200 to confirm bearish momentum.
Volume increase on the downside
Trade closed: target reached
Congratulations guys sell side analysis based target has been hit successfully reached the zone Best Analysis xauusd single
t.me/+uAIef7IqwSs4M2Q0
VIP PREMIMUM ANALYSIS ROOM SIGNALS
t.me/+uAIef7IqwSs4M2Q0
t.me/+uAIef7IqwSs4M2Q0
VIP PREMIMUM ANALYSIS ROOM SIGNALS
t.me/+uAIef7IqwSs4M2Q0
Disclaimer
The information and publications are not meant to be, and do not constitute, financial, investment, trading, or other types of advice or recommendations supplied or endorsed by TradingView. Read more in the Terms of Use.
Best Analysis xauusd single
t.me/+uAIef7IqwSs4M2Q0
VIP PREMIMUM ANALYSIS ROOM SIGNALS
t.me/+uAIef7IqwSs4M2Q0
t.me/+uAIef7IqwSs4M2Q0
VIP PREMIMUM ANALYSIS ROOM SIGNALS
t.me/+uAIef7IqwSs4M2Q0
Disclaimer
The information and publications are not meant to be, and do not constitute, financial, investment, trading, or other types of advice or recommendations supplied or endorsed by TradingView. Read more in the Terms of Use.