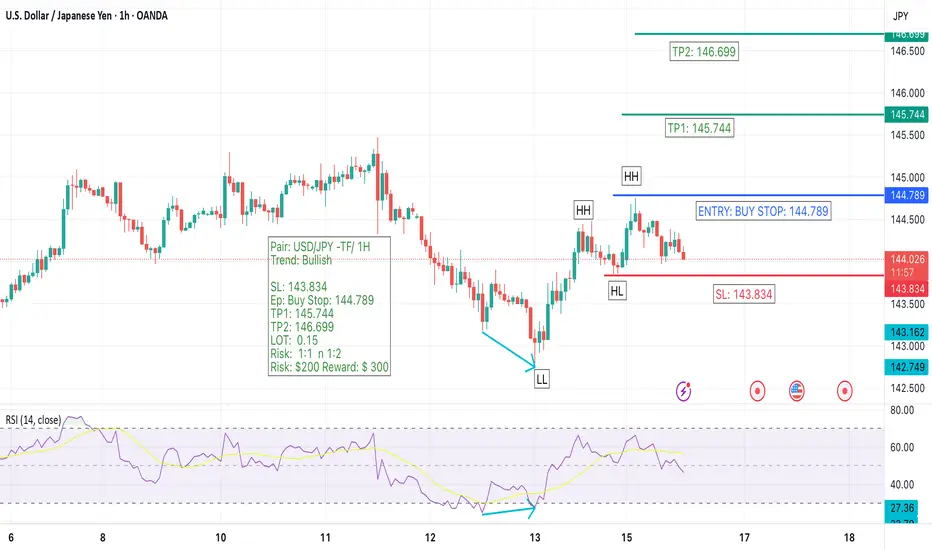
I’m currently monitoring the USD/JPY pair on the 1-hour chart. The pair was in a bearish trend earlier, but after forming a Bullish Divergence, it has started to print a series of Higher Highs (HHs) and Higher Lows (HLs) — a classic sign of trend reversal and strength.
I’m planning a Buy Stop entry above the most recent Higher High. If the breakout occurs, I’ll execute the trade based on this bullish continuation setup.
🧠 Technical Confluences:
✅ Bullish Divergence observed — signals momentum shift.
✅ Market Structure shifting to HHs and HLs.
✅ Entry planned above recent HH to confirm breakout.
📊 Trade Setup:
Pair USD/JPY
Timeframe 1H
Trend: Bullish
Entry: Buy Stop @ 144.789
Stop Loss: 143.834
Take Profit 1: 145.744
Take Profit 2: 146.699
Lot Size: 0.15
Risk–Reward 1:1 and 1:2
Risk $200
Reward $300
📌 Trade will be activated only upon confirmation — a break above the previous high. Stick to proper risk management.
🔖 Hashtags:
#USDJPY #Forex #ForexTrading #TechnicalAnalysis #PriceAction #BullishBreakout #ForexSetup #TradeIdeas #MarketStructure #ForexSignals #BuySetup #DivergenceTrading #1HChart #FXMarket #RiskManagement
Disclaimer
The information and publications are not meant to be, and do not constitute, financial, investment, trading, or other types of advice or recommendations supplied or endorsed by TradingView. Read more in the Terms of Use.
Disclaimer
The information and publications are not meant to be, and do not constitute, financial, investment, trading, or other types of advice or recommendations supplied or endorsed by TradingView. Read more in the Terms of Use.