USD/JPY (2H time frame), here is a breakdown:
📊 Technical Analysis Summary:
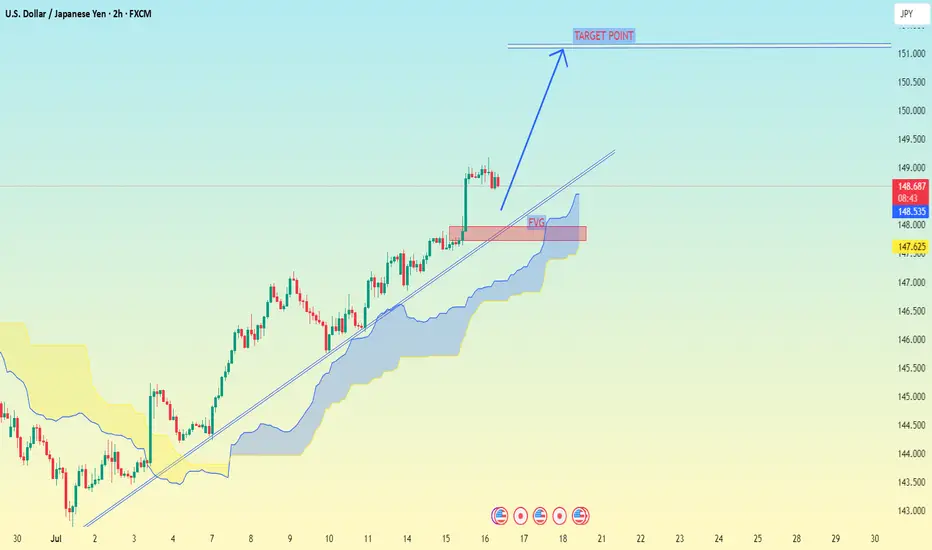
The chart shows an uptrend with price respecting a trendline.
Price is currently above the Ichimoku cloud, indicating bullish momentum.
A pullback zone (marked in red) is shown, likely suggesting a buying opportunity.
The chart indicates a projected move to the "Target Point" marked on the chart.
🎯 Target Level:
Target Point = 151.000
📌 Key Zones:
Support Zone / Pullback Entry: Around 147.80 to 148.20
Current Price: ~148.66
Resistance / Final Target: 151.000
✅ Trade Idea:
Buy on pullback near 148.00
Target: 151.000
Stop Loss: Below cloud or trendline, around 147.00
📊 Technical Analysis Summary:
The chart shows an uptrend with price respecting a trendline.
Price is currently above the Ichimoku cloud, indicating bullish momentum.
A pullback zone (marked in red) is shown, likely suggesting a buying opportunity.
The chart indicates a projected move to the "Target Point" marked on the chart.
🎯 Target Level:
Target Point = 151.000
📌 Key Zones:
Support Zone / Pullback Entry: Around 147.80 to 148.20
Current Price: ~148.66
Resistance / Final Target: 151.000
✅ Trade Idea:
Buy on pullback near 148.00
Target: 151.000
Stop Loss: Below cloud or trendline, around 147.00
Trade active
trade activet.me/RSI_Trading_Point4
Forex, gold and crypto signal's with detailed analysis & get consistent results..
t.me/Gold_Analysis_Experiment
Gold signal's with proper TP & SL for high profits opportunities..
Forex, gold and crypto signal's with detailed analysis & get consistent results..
t.me/Gold_Analysis_Experiment
Gold signal's with proper TP & SL for high profits opportunities..
Related publications
Disclaimer
The information and publications are not meant to be, and do not constitute, financial, investment, trading, or other types of advice or recommendations supplied or endorsed by TradingView. Read more in the Terms of Use.
t.me/RSI_Trading_Point4
Forex, gold and crypto signal's with detailed analysis & get consistent results..
t.me/Gold_Analysis_Experiment
Gold signal's with proper TP & SL for high profits opportunities..
Forex, gold and crypto signal's with detailed analysis & get consistent results..
t.me/Gold_Analysis_Experiment
Gold signal's with proper TP & SL for high profits opportunities..
Related publications
Disclaimer
The information and publications are not meant to be, and do not constitute, financial, investment, trading, or other types of advice or recommendations supplied or endorsed by TradingView. Read more in the Terms of Use.